Use the given data set to complete parts (a) through (c) below. (Use a=0.05.) 10 8. 13 8.74 6. 11 14 4 12 y 9.13 8.15 8.76 9.26 8.11 6.12 3.11 9.13 7.26 4.74 Click here to view a table of critical values for the correlation coefficient a. Construct a scatterplot. Choose the correct graph below. A. Oc. AY 10 AY 104- OD. Ay 10- Ay 10- 8- 8- 6- 8- 6- 8- 6- 4- 6- 4- 241 .......... 4. 2- 4- 04- 2- A 12 16 04 2- 12 16 12 16 0- b. Find the linear correlation coefficient, r, then determine whether there is sufficient evidence to support the claim of a linear correlation between the two variables. 8. 12 16 The linear correlation coefficient is r (Round to three decimal places as needed.)
Use the given data set to complete parts (a) through (c) below. (Use a=0.05.) 10 8. 13 8.74 6. 11 14 4 12 y 9.13 8.15 8.76 9.26 8.11 6.12 3.11 9.13 7.26 4.74 Click here to view a table of critical values for the correlation coefficient a. Construct a scatterplot. Choose the correct graph below. A. Oc. AY 10 AY 104- OD. Ay 10- Ay 10- 8- 8- 6- 8- 6- 8- 6- 4- 6- 4- 241 .......... 4. 2- 4- 04- 2- A 12 16 04 2- 12 16 12 16 0- b. Find the linear correlation coefficient, r, then determine whether there is sufficient evidence to support the claim of a linear correlation between the two variables. 8. 12 16 The linear correlation coefficient is r (Round to three decimal places as needed.)

Glencoe Algebra 1, Student Edition, 9780079039897, 0079039898, 2018
18th Edition
ISBN:9780079039897
Author:Carter
Publisher:Carter
Chapter4: Equations Of Linear Functions
Section4.5: Correlation And Causation
Problem 24PFA

Related questions
Question
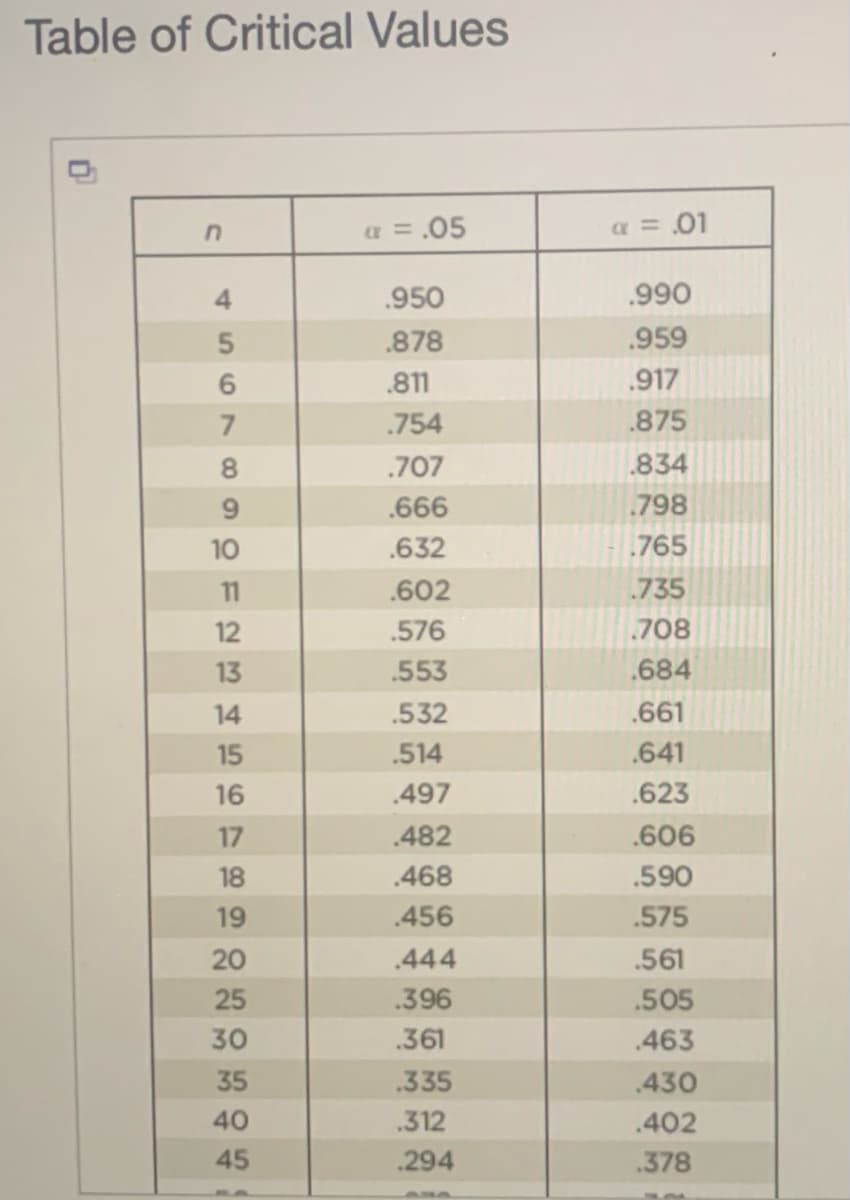
Transcribed Image Text:Table of Critical Values
a = .05
a = .01
4.
.950
.990
.878
.959
.811
.917
.754
.875
.707
.834
9.
.666
798
10
.632
765
11
.602
.735
12
.576
.708
13
.553
.684
14
.532
.661
15
.514
.641
16
.497
.623
17
.482
.606
18
.468
.590
19
.456
.575
20
.444
.561
25
.396
.505
30
.361
.463
35
.335
.430
40
.312
.402
45
.294
.378
567
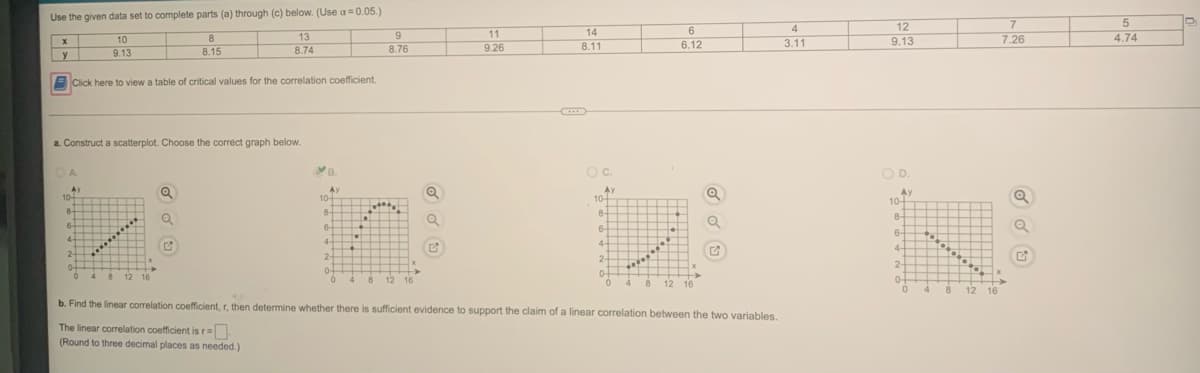
Transcribed Image Text:Use the given data set to complete parts (a) through (c) below. (Use a=0.05.)
12
7
9
11
14
6.
7.26
4.74
10
8
13
6.12
9.13
8.74
8.76
9.26
8.11
3.11
y
9.13
8.15
Click here to view a table of critical values for the correlation coefficient.
....
a. Construct a scatterplot. Choose the correct graph below.
B.
Oc.
OD.
A.
AY
10-
Ay
10-
Ay
10-
Ay
10-
8-
8-
8-
8-
6-
6
6-
6-
4-
4-
4-
4-
2-
2-
2-
2-
0-
4 8
4
8 12 16
12 16
0-
04
8.
12 16
4
12
16
b. Find the linear correlation coefficient, r, then determine whether there is sufficient evidence to support the claim of a linear correlation between the two variables.
The linear correlation coefficient is r=.
(Round to three decimal places as needed.)
Expert Solution
This question has been solved!
Explore an expertly crafted, step-by-step solution for a thorough understanding of key concepts.

This is a popular solution!

Trending now
This is a popular solution!

Step by step
Solved in 2 steps with 3 images

Recommended textbooks for you
Glencoe Algebra 1, Student Edition, 9780079039897…
Algebra
ISBN:
9780079039897
Author:
Carter
Publisher:
McGraw Hill
Glencoe Algebra 1, Student Edition, 9780079039897…
Algebra
ISBN:
9780079039897
Author:
Carter
Publisher:
McGraw Hill