Use the given data to find the equation of the regression line. Examine the scatterplot and identify a characteristic of the data that is ignored by the regression line. 12 8.15 10 12 12 8. 7.1 14 15 4 5 y 7.51 7. 6.67 6.82 12.53 9.1 5.87 5.19 8.19 5.65 Create a scatterplot of the data. Choose the correct graph below. OB. Oc. OD. AY 25 A 25 25 25 20 20 20 20 15 15 15 - 15 10 10 10- 10 16 5- 5- 05 10 15 20 25 10510 15 20 25 3 10 15 20 25 OS 10 15 20 25
Q: Here is data with y as the response variable. y 60 81.3 75.9 59.2 76.7 57.4 241.8 61.4 55.7 53 85…
A: The variable y is dependent variable and the variable x is independent variable for this study. The…
Q: Use the given data to find the equation of the regression line. Examine the scatterplot and identify…
A: Given data: x y 10 7.17 9 6.85 12 13.1 8 7.06 11 7.52 14 9.22 6 5.82 4 5.28 12…
Q: Find the equation of the regression line for the given data. Then construct a scatter plot of the…
A: From excel output the regression equation can be obtained as: Thus, the equation is
Q: Use the given data to find the equation of the regression line. Examine the scatterplot and identify…
A:
Q: Find the equation of the regression line for the given data. Then construct a scatter plot of the…
A: calculation procedure for regressionsum of (x) = ∑x = 840sum of (y) = ∑y = 2400sum of (x^2)= ∑x^2 =…
Q: Use the given data to find the equation of the regression line. Examine the scatterplot and identify…
A: You have drawn the scatter plot correctly. So I am going to show the regression line. The mean…
Q: Use the given data to find the equation of the regression line. Examine the scatterplot and identify…
A: Use EXCEL to construct the scatter plot. EXCEL procedure: Go to EXCEL Go to Insert menu Select…
Q: Use the given data to find the equation of the regression line. Examine the scatterplot and identify…
A: For the given data Find the Regression line
Q: Find the equation of the regression line for the given data. Then construct a scatter plot of the…
A: Step-by-step procedure to find regression equation using Excel. 1.Firstly , you have to enter the…
Q: Use the given data to find the equation of the regression line. Examine the scatterplot and identify…
A:
Q: Here is data with y as the response variable. y 31.1 87.3 29.8 74.7 22.3 71 50.1 68 110.9 34.1 70.2…
A: Hello, since your question has multiple sub-parts, we will solve first three sub-parts for you. If…
Q: Find the equation of the regression line for the given data. Then construct a scatter plot of the…
A: Note: Since you have asked multiple questions, we will solve the first question for you. If you…
Q: Assume you have noted the following prices for paperback books and the number of pages that each…
A: Regression : Regression analysis is used to measure the association (or) linear relationship between…
Q: Find the equation of the regression line for the given data. Then construct a scatter plot of the…
A: Use EXCEL to determine the regression equation. EXCEL procedure: Go to EXCEL Go to Data>Data…
Q: Use the given data to find the equation of the regression line. Examine the scatterplot and identify…
A: Given observation and calculation for regression is shown below (x) (y) x2 y2 xy 10 7.74 100…
Q: Find the equation of the regression line for the given data. Then construct a scatter plot of the…
A: 1) Software procedure for regression in EXCEL. Enter the given data in EXCEL sheet. Go to Data >…
Q: Use the given data to find the equation of the regression line. Examine the scatterplot and identify…
A:
Q: Use the given data to find the equation of the regression line. Examine the scatterplot and identify…
A: The independent variable is x. The dependent variable is y. We have to plot the scatter plot. On the…
Q: The data below are the average one-way commute times (in minutes) for selected students and the…
A: The independent variable is Commute time. The dependent variable is Number of absences. We have to…
Q: Use the given data to find the equation of the regression line. Examine the scatterplot and identify…
A:
Q: Use the given data to find the equation of the regression line. Examine the scatterplot and identify…
A: Linear regression: Suppose (x1, y1), (x2, y2)---(xn, yn) are n pairs of observations on variables X…
Q: Find the equation of the regression line for the given data. Then construct a scatter plot of the…
A: Regression Equation: y^=2.052 x + 116.097
Q: Find the equation of the regression line for the given data. Then construct a scatter plot of the…
A: We want to find the equation of regression line A) at X=180 B) at X=100 C) at X=150
Q: Use the given data to find the equation of the regression line. Examine the scatterplot and identify…
A: Use EXCEL to construct the scatter plot. EXCEL procedure: Go to EXCEL Go to Insert menu…
Q: Use the given data to find the equation of the regression line. Examine the scatterplot and identify…
A: The given data is: x y 9 7.23 7 6.89 13 12.87 8 7.34 11 7.87 13 9.22 6 5.87 4…
Q: Find the equation of the regression line for the given data. Then construct a scatter plot of the…
A: The least square regression line is given by, ŷ = bx+a Where b=…
Q: Use the given data to find the equation of the regression line. Examine the scatterplot and identify…
A: Hello there ! as the question asked about the scatter plot, the detailed calculation for regression…
Q: Find the equation of the regression line for the given data. Then construct a scatter plot of the…
A:
Q: Find the equation of the regression line for the given data. Then construct a scatter plot of the…
A: Given data is Height x 766 620 520 508 494 484 stories y 51 46 45 43 39 35
Q: Use the given data to find the equation of the regression line. Examine the scatterplot and identify…
A: Given See the Excel output
Q: Find the equation of the regression line for the given data. Then construct a scatter plot of the…
A:
Q: Use the given data to find the equation of the regression line. Examine the scatterplot and identify…
A: Solution
Q: Find the equation of the regression line for the given data. Then construct a scatter plot of the…
A:
Q: Use the given data to find the equation of the regression line. Examine the scatterplot and identify…
A: Given: Sr. No. x y 1 11 7.39 2 9 6.52 3 13 12.69 4 9 7.28 5 10 7.68 6 14 8.88 7 6…
Q: Here is data with y as the response variable. x y 43.7 85.5 32.3 95.9 61.5 68.4 37.5 85.7 39.2 80.9…
A: As per our guidelines, we are allowed to answer first three sub-parts . Thanks Given Data : x y…
Q: Find the equation of the regression line for the given data. Then construct a scatter plot of the…
A: The following data values shows the heights (in feet) and the number of stories of six notable…
Q: Find the equation of the regression line for the given data. Then construct a scatter plot of the…
A: For the given data find regression equation
Q: Find the equation of the regression line for the given data. Then construct a scatter plot of the…
A:
Q: Use the given data to find the equation of the regression line. Examine the scatterplot and identify…
A:
Q: Use the given data to find the equation of the regression line. Examine the scatterplot and identify…
A:
Q: Use the given data to find the equation of the regression line. Examine the scatterplot and identify…
A:
Q: Use the given data to find the equation of the regression line. Examine the scatterplot and identify…
A:
Q: Use the given data to find the equation of the regression line. Examine the scatterplot and identify…
A: The independent variable is x. The dependent variable is y. We have to construct the scatter plot…
Q: Find the equation of the regression line for the given data. Then construct a scatter plot of the…
A: The scatterplot is used to see the correlation between two variables (dependent and independent). It…
Q: Use the given data to find the equation of the regression line. Examine the scatterplot and identify…
A: Use the given data to find the equation of the regression line. Exami ne the scatterplot and…
Q: Use the given data to find the equation of the regression line. Examine the scatterplot and identify…
A: The data is, x 9 8 11 8 11 13 6 4 13 6 5 y 7.24 6.87 12.87 6.87 7.75 8.85 6.28 5.61 8.28 6.72…
Q: Find the equation of the regression line for the given data. Then construct a scatter plot of the…
A: Hi! Thank you for the question, As per the honor code, we are allowed to answer three sub-parts at a…
Q: Find the equation of the regression line for the given data. Then construct a scatter plot of the…
A: Software procedure for regression in EXCEL. Enter the given data in EXCEL sheet. Go to Data >…
Q: Use the given data to find the equation of the regression line. Examine the scatterplot and identify…
A: For the given data, First we have to make scatter plot, Than we have to calculate regression…
Q: Use the given data to find the equation of the regression line. Examine the scatterplot and identify…
A: The independent variable is x. The dependent variable is y. This is simple linear regression model.…
I need the Graph and also B & C
A. Find the equation of the regression line. Y=
C. Identify a characteristic of the data that is ignored by the regression line
please help I need in an hour !
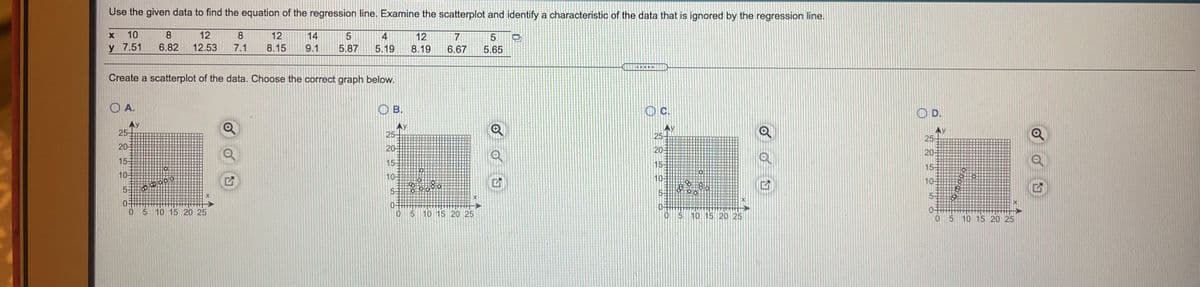
Step by step
Solved in 4 steps with 2 images
- Life Expectancy The following table shows the average life expectancy, in years, of a child born in the given year42 Life expectancy 2005 77.6 2007 78.1 2009 78.5 2011 78.7 2013 78.8 a. Find the equation of the regression line, and explain the meaning of its slope. b. Plot the data points and the regression line. c. Explain in practical terms the meaning of the slope of the regression line. d. Based on the trend of the regression line, what do you predict as the life expectancy of a child born in 2019? e. Based on the trend of the regression line, what do you predict as the life expectancy of a child born in 1580?2300Mr. James McWhinney, president of Daniel-James Financial Services, believesthere is a relationship between the number of client contacts and the dollar amountof sales. To document this assertion, Mr. McWhinney gathered the following sampleinformation. The x column indicates the number of client contacts last month andthe y column shows the value of sales ($ thousands) last month for each clientsampled a. Determine the regression equation.b. Determine the estimated sales if 40 contacts are madeThe personnel director of a large hospital is interested in determining the relationship (if any) between an employee’s age and the number of sick days the employee takes per year. The director randomly selects ten employees and records their age and the number of sick days which they took in the previous year. Employee 1 2 3 4 5 6 7 8 9 10Age 30 50 40 55 30 28 60 25 30 45Sick Days 7 4 3 2 9 10 0 8 5 2 The estimated regression equation and the standard error are given. Sick Days=14.310162−0.236900(Age) Se=1.682207 Find the 95% prediction interval for the average number of sick days an employee will take per year, given the employee is 34 . Round your answer to two decimal places.
- The following ordered pairs provide data about some Nestlé snacks, where the first number is grams of sugar and the second is the number of calories for each snack. (3, 110), (14, 180), (13, 150), (11, 120), (8, 100), (5, 70), (7, 140), (15, 200), (12, 130) a. Construct a scatter plot of the data. Does a clear linear relationship exist between the two variables? b. Estimate the regression equation and identify the value of the slope. c. Which conclusion can you draw from your results?The heights above sea level and average winter temperatures of cities in a particular country are collected. The summary statistics for this data are as follows: Sea level: AVG = 5400 ft, SD = 2100 ftAverage winter temperatures: AVG = 40 degrees F, SD = 25 degrees Fr = -0.7 If a city is 5000 ft above sea level, what is its predicted average winter temperature, using the regression line to make the prediction? Choose the answer that is closest. Group of answer choices 50 degrees F 45 degrees F 35 degrees F 40 degrees FA random sample of ten professional athletes produced the following data where x is the number of endorsements the player has and y is the amount of money made (in millions of dollars). x y x y 0 2 5 12 3 8 4 9 2 7 3 9 1 3 0 3 5 13 4 10 Draw a scatter plot of the data. Use regression to find the equation for the line of best fit. Draw the line of best fit on the scatter plot. What is the slope of the line of best fit? What does it represent? What is the y-intercept of the line of best fit? What does it represent? What does an r value of zero mean?
- Find two lines of regressions from the following Data: Age of husband : 25, 21, 22.5, 26.3, 35.7, 20.8, 22.9, 40.6, 25.2, 18.1 Age of wife: 16.3, 15.1, 20.9, 17.0, 22.6, 14.3, 18.9, 21.0, 15.6, 14.8 Estimate the following: a. The age of husband when age of wife is 21.5 b. Age of wife when age of husband is 45.9 c. The correlation coefficient.Find the equation of the regression line for the given data. Then construct a scatter plot of the data and draw the regression line. (Each pair of variables has a significant correlation.) Then use the regression equation to predict the value of y for each of the given x-values, if meaningful. The caloric content and the sodium content (in milligrams) for 6 beef hot dogs are shown in the table below. Calories, X 160 180 120 120 70 190 Sodium, Y 430 480 320 370 240 530 (a) x= 170 calories (b) x= 90 calories (c) x=140 calories (d) x=210 caloriesUse the given data to find the equation of the regression line. Examine the scatterplot and identify a characteristic of the data that is ignored by the regression line. x 7 4 12 3 6 10 8 13 11 5 9 y 14.61 7.56 18.76 4.45 12.64 18.24 16.21 18.45 18.70 10.30 17.41 y^=???+1.41.4x (Round to two decimal places as needed.)
- Use the given data to find the equation of the regression line. Examine the scatterplot and identify a characteristic of the data that is ignored by the regression line. x 6 5 11 4 9 10 7 12 8 3 13 y 7.16 5.68 9.28 3.84 9.50 9.56 8.30 8.64 9.08 1.64 7.64Find the equation of the regression line for the given data. Then construct a scatter plot of the data and draw the regression line. (Each pair of variables has a significant correlation.) Then use the regression equation to predict the value of y for each of the given x-values, if meaningful. The caloric content and the sodium content (in milligrams) for 6 beef hot dogs are shown in the table below. Calories, x 160 170 120 130 90 180 Sodium, y 415 465 340 370 250 510 The equation of the regression line is ŷ = ______ x + ______ (Round the slope to three decimal places as needed. Round the y-intercept to two decimal places as needed.) (a) x = 180 calories, (b) x = 100 calories, (c) x = 140 calories, (d) x = 220 calories Use the regression equation to predict the value of y for each of the given x-values, if meaningful. If the x-value is not meaningful to predict the value of y, explain why not. (Round the slope to…A sales manager collected the following data on annual sales for new customer accounts and the number of years of experience for a sample of 10 salespersons. Click on the datafile logo to reference the data. a. Choose the correct scatter diagram for these data with years of experience as the independent variable. B (NEED ANSWERS FOR B and C) b. Develop an estimated regression equation that can be used to predict annual sales given the years of experience. c. Use the estimated regression equation to predict annual sales for a salesperson with 9 years of experience (to the nearest whole number).