Use the given data to find the equation of the regression line. Examine the scatterplot and identify a characteristic of the data that is ignored by the regression line. 9. 8 11 9. 11 14 4 12 y 7.47 6.66 13.28 7.1 7.59 8.43 6.09 5.39 7.9 6.48 5.65 OA. OB. Oc. OD. Ay 25- Ay 25- Ay 25- Ay 25- 20 20 20 20 155 155 155 15- to 10- 105 10- 10- 53 55 55 0- O 5 10 15 20 25 0- Ó 5 10 15 20 25 0- O 5 10 15 20 25 -> 05 10 15 20 25 Find the equation of the regression line. (Round the constant two decimal places as needed. Round the coefficient to three decimal places as needed.) Identify a characteristic of the data that is ignored by the regression line. O A. There is an influential point that strongly affects the graph of the regression line. B. There is no characteristic of the data that is ignored by the regression line. OC. The data has a pattern that is not a straight line. O D. There is no trend in the data.
Use the given data to find the equation of the regression line. Examine the scatterplot and identify a characteristic of the data that is ignored by the regression line. 9. 8 11 9. 11 14 4 12 y 7.47 6.66 13.28 7.1 7.59 8.43 6.09 5.39 7.9 6.48 5.65 OA. OB. Oc. OD. Ay 25- Ay 25- Ay 25- Ay 25- 20 20 20 20 155 155 155 15- to 10- 105 10- 10- 53 55 55 0- O 5 10 15 20 25 0- Ó 5 10 15 20 25 0- O 5 10 15 20 25 -> 05 10 15 20 25 Find the equation of the regression line. (Round the constant two decimal places as needed. Round the coefficient to three decimal places as needed.) Identify a characteristic of the data that is ignored by the regression line. O A. There is an influential point that strongly affects the graph of the regression line. B. There is no characteristic of the data that is ignored by the regression line. OC. The data has a pattern that is not a straight line. O D. There is no trend in the data.

College Algebra
7th Edition
ISBN:9781305115545
Author:James Stewart, Lothar Redlin, Saleem Watson
Publisher:James Stewart, Lothar Redlin, Saleem Watson
Chapter1: Equations And Graphs
Section: Chapter Questions
Problem 10T: Olympic Pole Vault The graph in Figure 7 indicates that in recent years the winning Olympic men’s...

Related questions

Concept explainers
Contingency Table
A contingency table can be defined as the visual representation of the relationship between two or more categorical variables that can be evaluated and registered. It is a categorical version of the scatterplot, which is used to investigate the linear relationship between two variables. A contingency table is indeed a type of frequency distribution table that displays two variables at the same time.
Binomial Distribution
Binomial is an algebraic expression of the sum or the difference of two terms. Before knowing about binomial distribution, we must know about the binomial theorem.
Topic Video
Question
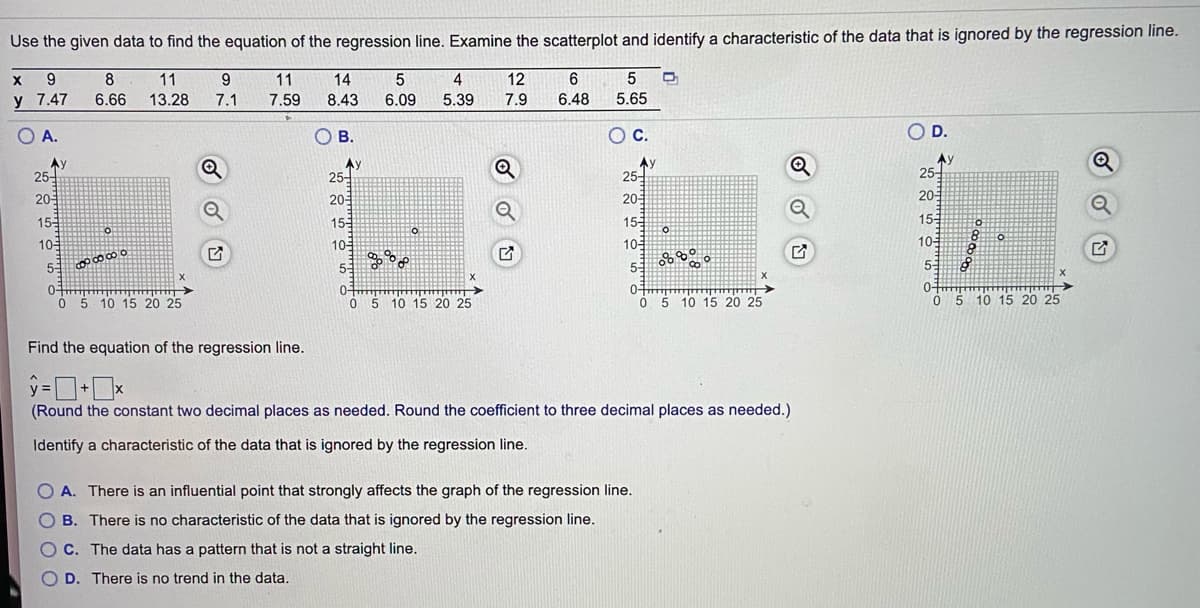
Transcribed Image Text:Use the given data to find the equation of the regression line. Examine the scatterplot and identify a characteristic of the data that is ignored by the regression line.
9.
8
11
9.
11
14
4
12
y 7.47
6.66
13.28
7.1
7.59
8.43
6.09
5.39
7.9
6.48
5.65
O A.
OB.
Oc.
OD.
Ay
25-
Ay
25-
Ay
25-
AV
25-
20
20
20
20
15
15-
15-
15
10
10-
10-
10-
55
51
5-
0-
Ó 5 10 15 20 25
0-
05 10 15 20 25
0-
5 10 15 20 25
O 5 10 15 20 25
Find the equation of the regression line.
(Round the constant two decimal places as needed. Round the coefficient to three decimal places as needed.)
Identify a characteristic of the data that is ignored by the regression line.
O A. There is an influential point that strongly affects the graph of the regression line.
O B. There is no characteristic of the data that is ignored by the regression line.
O C. The data has a pattern that is not a straight line.
D. There is no trend in the data.
Expert Solution
This question has been solved!
Explore an expertly crafted, step-by-step solution for a thorough understanding of key concepts.

Step by step
Solved in 3 steps with 2 images

Knowledge Booster


Learn more about
Need a deep-dive on the concept behind this application? Look no further. Learn more about this topic, statistics and related others by exploring similar questions and additional content below.Recommended textbooks for you
College Algebra
Algebra
ISBN:
9781305115545
Author:
James Stewart, Lothar Redlin, Saleem Watson
Publisher:
Cengage Learning

Glencoe Algebra 1, Student Edition, 9780079039897…
Algebra
ISBN:
9780079039897
Author:
Carter
Publisher:
McGraw Hill

Functions and Change: A Modeling Approach to Coll…
Algebra
ISBN:
9781337111348
Author:
Bruce Crauder, Benny Evans, Alan Noell
Publisher:
Cengage Learning
College Algebra
Algebra
ISBN:
9781305115545
Author:
James Stewart, Lothar Redlin, Saleem Watson
Publisher:
Cengage Learning
Glencoe Algebra 1, Student Edition, 9780079039897…
Algebra
ISBN:
9780079039897
Author:
Carter
Publisher:
McGraw Hill
Functions and Change: A Modeling Approach to Coll…
Algebra
ISBN:
9781337111348
Author:
Bruce Crauder, Benny Evans, Alan Noell
Publisher:
Cengage Learning