Use the given information to find the critical values X and X. (Use technology or the attached Chi-Square tab Platelet Counts of Women 99% confidence n=28 s-65.8 ChiSquare.pdf A. 9.542 and 40.289 O B. 15.308 and 44.461 O C. 11.808 and 49.645
Use the given information to find the critical values X and X. (Use technology or the attached Chi-Square tab Platelet Counts of Women 99% confidence n=28 s-65.8 ChiSquare.pdf A. 9.542 and 40.289 O B. 15.308 and 44.461 O C. 11.808 and 49.645

MATLAB: An Introduction with Applications
6th Edition
ISBN:9781119256830
Author:Amos Gilat
Publisher:Amos Gilat
Chapter1: Starting With Matlab
Section: Chapter Questions
Problem 1P

Related questions
Topic Video
Question
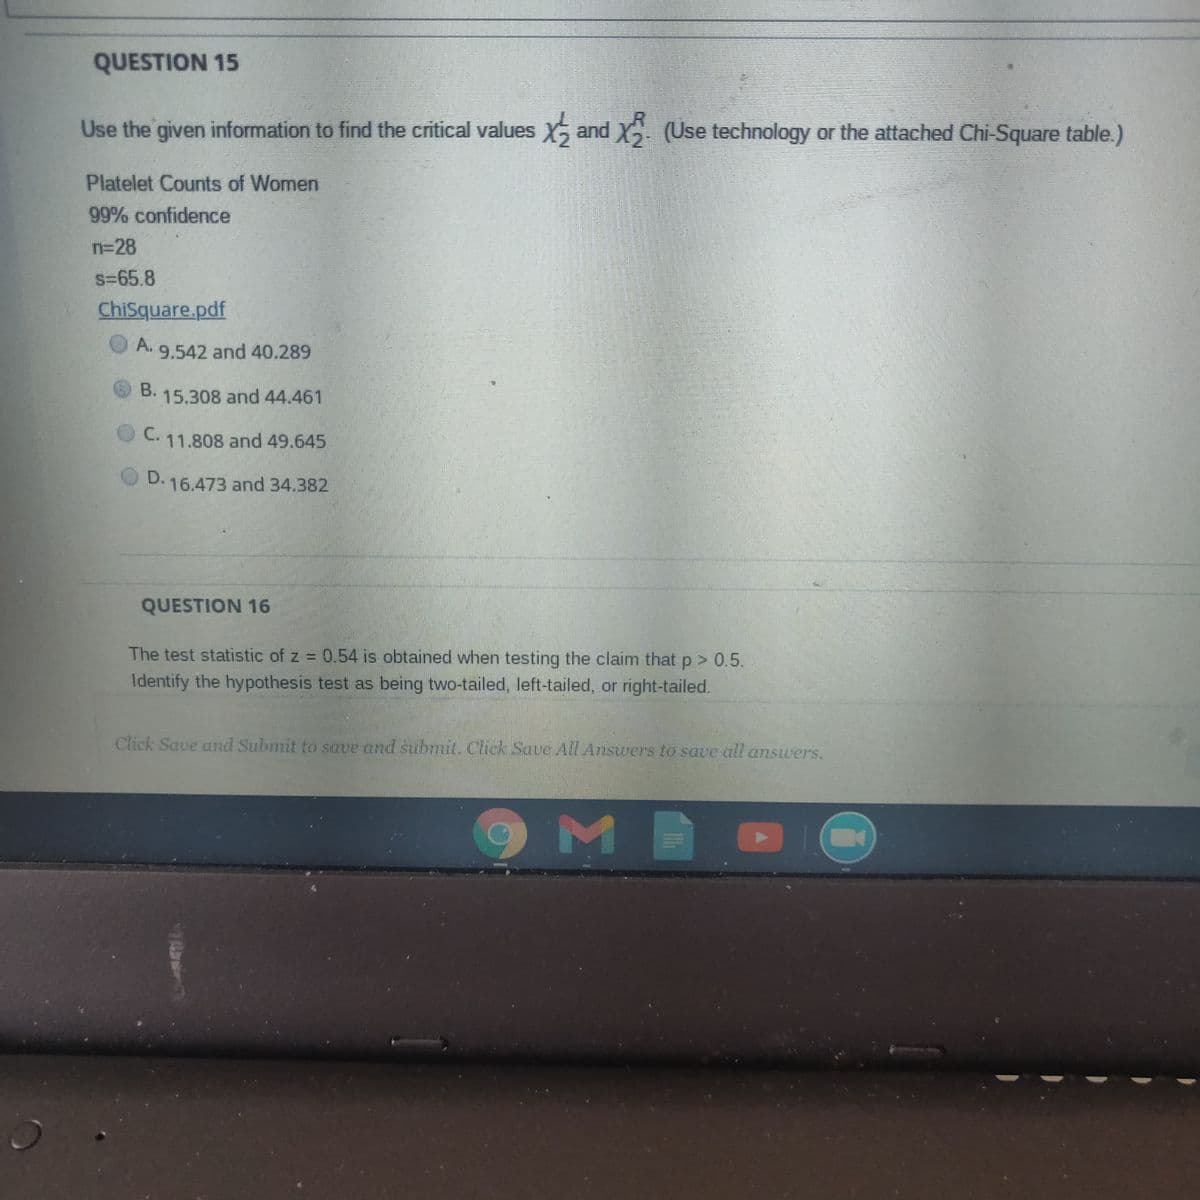
Transcribed Image Text:QUESTION 15
Use the given information to find the critical values X and X (Use technology or the attached Chi-Square table.)
Platelet Counts of Women
99% confidence
n=28
s=65.8
ChiSquare.pdf
A.
9.542 and 40.289
B.
15.308 and 44.461
C11.808 and 49.645
16.473 and 34.382
QUESTION 16
The test statistic of z = 0.54 is obtained when testing the claim that p > 0.5.
Identify the hypothesis test as being two-tailed, left-tailed, or right-tailed.
Click Save and Submit to save and submit. Click Save All Answers to save all answers.
Expert Solution
This question has been solved!
Explore an expertly crafted, step-by-step solution for a thorough understanding of key concepts.

This is a popular solution!

Trending now
This is a popular solution!

Step by step
Solved in 2 steps with 6 images

Knowledge Booster


Learn more about
Need a deep-dive on the concept behind this application? Look no further. Learn more about this topic, statistics and related others by exploring similar questions and additional content below.Recommended textbooks for you
MATLAB: An Introduction with Applications
Statistics
ISBN:
9781119256830
Author:
Amos Gilat
Publisher:
John Wiley & Sons Inc

Probability and Statistics for Engineering and th…
Statistics
ISBN:
9781305251809
Author:
Jay L. Devore
Publisher:
Cengage Learning

Statistics for The Behavioral Sciences (MindTap C…
Statistics
ISBN:
9781305504912
Author:
Frederick J Gravetter, Larry B. Wallnau
Publisher:
Cengage Learning
MATLAB: An Introduction with Applications
Statistics
ISBN:
9781119256830
Author:
Amos Gilat
Publisher:
John Wiley & Sons Inc
Probability and Statistics for Engineering and th…
Statistics
ISBN:
9781305251809
Author:
Jay L. Devore
Publisher:
Cengage Learning
Statistics for The Behavioral Sciences (MindTap C…
Statistics
ISBN:
9781305504912
Author:
Frederick J Gravetter, Larry B. Wallnau
Publisher:
Cengage Learning

Elementary Statistics: Picturing the World (7th E…
Statistics
ISBN:
9780134683416
Author:
Ron Larson, Betsy Farber
Publisher:
PEARSON

The Basic Practice of Statistics
Statistics
ISBN:
9781319042578
Author:
David S. Moore, William I. Notz, Michael A. Fligner
Publisher:
W. H. Freeman

Introduction to the Practice of Statistics
Statistics
ISBN:
9781319013387
Author:
David S. Moore, George P. McCabe, Bruce A. Craig
Publisher:
W. H. Freeman