Use the given information to find the number of degrees of freedom, the critical values xỉ and xR, and the confidence interval estimate of a. o. It is reasonable to assume that a simple random sample has been selected from a population with a normal distribution. Platelet Counts of Women 95% confidence; n= 28, s = 65.3. Click the icon to view the table of Chi-Square critical values. df = (Type a whole number.) (Round to three decimal places as needed.) (Round to three decimal places as needed.) The confidence interval estimate of o is
Use the given information to find the number of degrees of freedom, the critical values xỉ and xR, and the confidence interval estimate of a. o. It is reasonable to assume that a simple random sample has been selected from a population with a normal distribution. Platelet Counts of Women 95% confidence; n= 28, s = 65.3. Click the icon to view the table of Chi-Square critical values. df = (Type a whole number.) (Round to three decimal places as needed.) (Round to three decimal places as needed.) The confidence interval estimate of o is

MATLAB: An Introduction with Applications
6th Edition
ISBN:9781119256830
Author:Amos Gilat
Publisher:Amos Gilat
Chapter1: Starting With Matlab
Section: Chapter Questions
Problem 1P

Related questions

Question
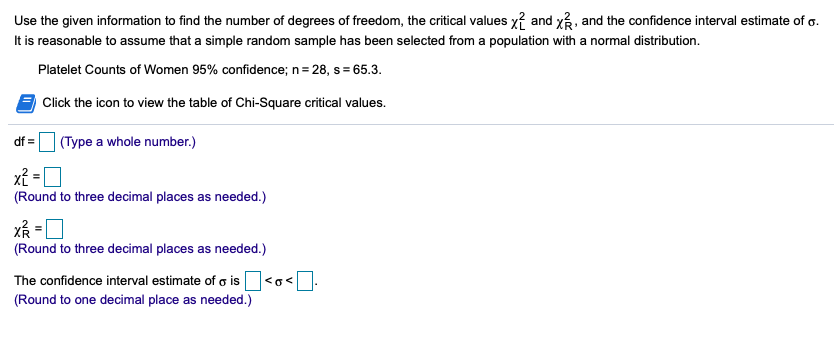
Use the given information to find the number of degrees of freedom, the critical values χ2L and χ2R, and the confidence interval estimate of σ.
It is reasonable to assume that a simple random sample has been selected from a population with anormal distribution.
It is reasonable to assume that a simple random sample has been selected from a population with a
Platelet Counts of Women 95% confidence; n=28, s=65.3.
Area to the Right of the Critical Value
Degrees of Freedom 0.995 0.99 0.975 0.95 0.90 0.10 0.05 0.025 0.01 0.005 Degrees of Freedom
1 - - 0.001 0.004 0.016 2.706 3.841 5.024 6.635 7.879 1
2 0.010 0.020 0.051 0.103 0.211 4.605 5.991 7.378 9.210 10.597 2
3 0.072 0.115 0.216 0.352 0.584 6.251 7.815 9.348 11.345 12.838 3
4 0.207 0.297 0.484 0.711 1.064 7.779 9.488 11.143 13.277 14.860 4
5 0.412 0.554 0.831 1.145 1.610 9.236 11.071 12.833 15.086 16.750 5
6 0.676 0.872 1.237 1.635 2.204 10.645 12.592 14.449 16.812 18.548 6
7 0.989 1.239 1.690 2.167 2.833 12.017 14.067 16.013 18.475 20.278 7
8 1.344 1.646 2.180 2.733 3.490 13.362 15.507 17.535 20.090 21.955 8
9 1.735 2.088 2.700 3.325 4.168 14.684 16.919 19.023 21.666 23.589 9
10 2.156 2.558 3.247 3.940 4.865 15.987 18.307 20.483 23.209 25.188 10
11 2.603 3.053 3.816 4.575 5.578 17.275 19.675 21.920 24.725 26.757 11
12 3.074 3.571 4.404 5.226 6.304 18.549 21.026 23.337 26.217 28.299 12
13 3.565 4.107 5.009 5.892 7.042 19.812 22.362 24.736 27.688 29.819 13
14 4.075 4.660 5.629 6.571 7.790 21.064 23.685 26.119 29.141 31.319 14
15 4.601 5.229 6.262 7.261 8.547 22.307 24.996 27.488 30.578 32.801 15
16 5.142 5.812 6.908 7.962 9.312 23.542 26.296 28.845 32.000 34.267 16
17 5.697 6.408 7.564 8.672 10.085 24.769 27.587 30.191 33.409 35.718 17
18 6.265 7.015 8.231 9.390 10.865 25.989 28.869 31.526 34.805 37.156 18
19 6.844 7.633 8.907 10.117 11.651 27.204 30.144 32.852 36.191 38.582 19
20 7.434 8.260 9.591 10.851 12.443 28.412 31.410 34.170 37.566 39.997 20
21 8.034 8.897 10.283 11.591 13.240 29.615 32.671 35.479 38.932 41.401 21
22 8.643 9.542 10.982 12.338 14.042 30.813 33.924 36.781 40.289 42.796 22
23 9.260 10.196 11.689 13.091 14.848 32.007 35.172 38.076 41.638 44.181 23
24 9.886 10.856 12.401 13.848 15.659 33.196 36.415 39.364 42.980 45.559 24
25 10.520 11.524 13.120 14.611 16.473 34.382 37.652 40.646 44.314 46.928 25
26 11.160 12.198 13.844 15.379 17.292 35.563 38.885 41.923 45.642 48.290 26
27 11.808 12.879 14.573 16.151 18.114 36.741 40.113 43.194 46.963 49.645 27
28 12.461 13.565 15.308 16.928 18.939 37.916 41.337 44.461 48.278 50.993 28
29 13.121 14.257 16.047 17.708 19.768 39.087 42.557 45.722 49.588 52.336 29
30 13.787 14.954 16.791 18.493 20.599 40.256 43.773 46.979 50.892 53.672 30
40 20.707 22.164 24.433 26.509 29.051 51.805 55.758 59.342 63.691 66.766 40
50 27.991 29.707 32.357 34.764 37.689 63.167 67.505 71.420 76.154 79.490 50
60 35.534 37.485 40.482 43.188 46.459 74.397 79.082 83.298 88.379 91.952 60
70 43.275 45.442 48.758 51.739 55.329 85.527 90.531 95.023 100.425 104.215 70
80 51.172 53.540 57.153 60.391 64.278 96.578 101.879 106.629 112.329 116.321 80
90 59.196 61.754 65.647 69.126 73.291 107.565 113.145 118.136 124.116 128.299 90
100 67.328 70.065 74.222 77.929 82.358 118.498 124.342 129.561 135.807 140.169 100
0.995 0.99 0.975 0.95 0.90 0.10 0.05 0.025 0.01 0.005
Area to the Right of the Critical Value
Degrees of Freedom
n-1Confidence interval or hypothesis test for a standard deviation sigma or variance sigma superscript 2
k-1Goodness-of-fit with k categories
(r-1)(c-1)Contingency table with r rows and c columns
k-1Kruskal-Wallis test with k samples
Transcribed Image Text:Use the given information to find the number of degrees of freedom, the critical values x? and x, and the confidence interval estimate of o.
It is reasonable to assume that a simple random sample has been selected from a population with a normal distribution.
Platelet Counts of Women 95% confidence; n= 28, s = 65.3.
Click the icon to view the table of Chi-Square critical values.
df =I (Type a whole number.)
%3D
xỉ = [
(Round to three decimal places as needed.)
(Round to three decimal places as needed.)
The confidence interval estimate of g is
(Round to one decimal place as needed.)
<o<
Expert Solution
This question has been solved!
Explore an expertly crafted, step-by-step solution for a thorough understanding of key concepts.

This is a popular solution!

Trending now
This is a popular solution!

Step by step
Solved in 2 steps

Follow-up Questions
Read through expert solutions to related follow-up questions below.
Follow-up Question
White Blood Counts of Women 95% confidence; n=146,s=1.99(1000 cells/ /μL). df (Type a whole number.) xL2= (Round to two decimal places as needed.) χR2= (Round to two decimal places as needed.) The confidence
Solution
Knowledge Booster


Learn more about
Need a deep-dive on the concept behind this application? Look no further. Learn more about this topic, statistics and related others by exploring similar questions and additional content below.Recommended textbooks for you
MATLAB: An Introduction with Applications
Statistics
ISBN:
9781119256830
Author:
Amos Gilat
Publisher:
John Wiley & Sons Inc

Probability and Statistics for Engineering and th…
Statistics
ISBN:
9781305251809
Author:
Jay L. Devore
Publisher:
Cengage Learning

Statistics for The Behavioral Sciences (MindTap C…
Statistics
ISBN:
9781305504912
Author:
Frederick J Gravetter, Larry B. Wallnau
Publisher:
Cengage Learning
MATLAB: An Introduction with Applications
Statistics
ISBN:
9781119256830
Author:
Amos Gilat
Publisher:
John Wiley & Sons Inc
Probability and Statistics for Engineering and th…
Statistics
ISBN:
9781305251809
Author:
Jay L. Devore
Publisher:
Cengage Learning
Statistics for The Behavioral Sciences (MindTap C…
Statistics
ISBN:
9781305504912
Author:
Frederick J Gravetter, Larry B. Wallnau
Publisher:
Cengage Learning

Elementary Statistics: Picturing the World (7th E…
Statistics
ISBN:
9780134683416
Author:
Ron Larson, Betsy Farber
Publisher:
PEARSON

The Basic Practice of Statistics
Statistics
ISBN:
9781319042578
Author:
David S. Moore, William I. Notz, Michael A. Fligner
Publisher:
W. H. Freeman

Introduction to the Practice of Statistics
Statistics
ISBN:
9781319013387
Author:
David S. Moore, George P. McCabe, Bruce A. Craig
Publisher:
W. H. Freeman