Use the graph to calculate consumer surplus when the market is at equilibrium. Price $40 30 20 15 10 D 100 150 200 300 Quantity A $3,000 $5,000 C $2,000 $4,000
Use the graph to calculate consumer surplus when the market is at equilibrium. Price $40 30 20 15 10 D 100 150 200 300 Quantity A $3,000 $5,000 C $2,000 $4,000

Chapter3: Market Demand And Supply
Section3.A: Consumer Surplus, Proudcer Suplus, And Market Efficency
Problem 16SQ

Related questions
Question
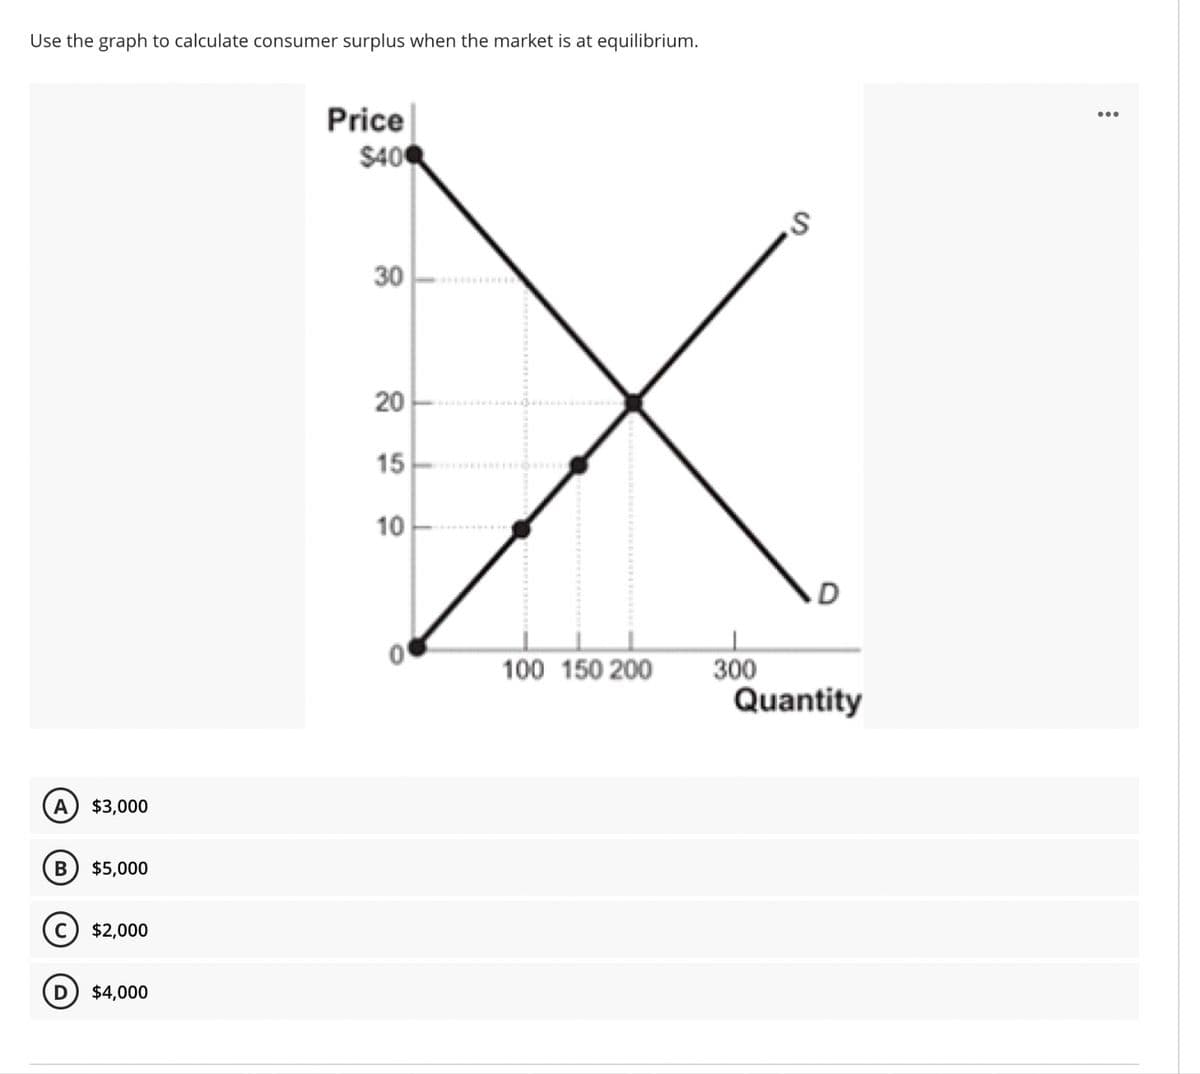
Transcribed Image Text:Use the graph to calculate consumer surplus when the market is at equilibrium.
Price
$400
30
15
10
100 150 200
300
Quantity
A
$3,000
В
$5,000
$2,000
$4,000
20
Expert Solution
This question has been solved!
Explore an expertly crafted, step-by-step solution for a thorough understanding of key concepts.

This is a popular solution!

Trending now
This is a popular solution!

Step by step
Solved in 2 steps

Knowledge Booster


Learn more about
Need a deep-dive on the concept behind this application? Look no further. Learn more about this topic, economics and related others by exploring similar questions and additional content below.Recommended textbooks for you


Economics (MindTap Course List)
Economics
ISBN:
9781337617383
Author:
Roger A. Arnold
Publisher:
Cengage Learning
