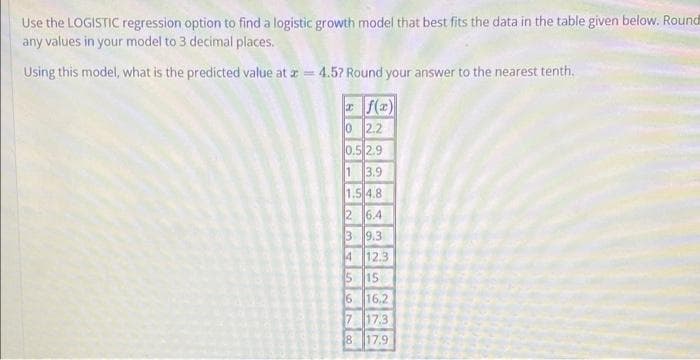
Use the LOGISTIC regression option to find a logistic growth model that best fits the data in the table given below. any values in your model to 3 decimal places. Using this model, what is the predicted value at a 4.57 Round your answer to the nearest tenth. a f(x) 0 2.2


Q: ExpectancyY It is believed that there is a logarithmic relation between life expectancy and the…
A:
Q: 103,000 The logistic growth function f(t)= describes the number of people, f(t), who have become ill…
A: f(t)=103,0001+5400 e-tcomparing with logistic growth modelequation:f(t)=c1+a e-btc=carrying…
Q: A ship carrying 1000 passengers is wrecked on a small island from which the passengers are never…
A:
Q: (a) What is a log-log plot?(b) If a log-log plot of your data lies approximately on a line, what…
A: (a) Consider the data points (m,n)When a graph is plotted between log m and log n, then the plot is…
Q: 150 The spread of flu in a certain school is given by the formula P(t)=1+ 1+e13-t where t is the…
A: Logistics Function:P(t)=c1+a.e-ktwhere c is the carrying capacity k is the growth constant
Q: Consider a population that grows according to the logistic growth model with initial population…
A: Consider the given information. The growth equation is defined as. P=P0ert As the population needs…
Q: Nonlinear regression Logistic curve: Yı= a/ 1+ el(b – year /c )) + ɛ how do you relate it to the…
A: Logistic function is also referred as Sigmoid Function taking the real values ranging between 0 and…
Q: A ship carrying 1000 passengers is wrecked on a small island from which the passengers are never…
A:
Q: precalc question
A:
Q: Consider the logistic growth model variables to solve the equation. Here t represents time in weeks.…
A:
Q: Find the formula for logistic growth using the given information. (Use t as your variable.) The…
A: Consider the given information. The formula for logistic growth is defined as, dNdt=rNK-NK Where,…
Q: (d) Log-odds of men choosing Commerical A: Encoding x=0 for men and x-1 for women, do a logistic…
A: From the given data, we obtain a table like: Commercial A Commercial B Total Women 90 75 165…
Q: A researcher is trying to predict the number of people who will get COVID 19 if they didn't get a…
A: Logistic regression follows some assumptions. They are Dependent variable is nominal variable with…
Q: exponential curve of the form y = ab* to the following data: Fit an
A: Consider, y=abxApply 'log' on both sides,lny=lna+xlnb Given information: x y lnY 1 1 0 2 1.2…
Q: a. Using Sherie's data, find the best-fit exponential equation for this growth, through both the…
A: given days after march 1st 0 1 5 10 population 57 95 700 8525
Q: Consider the following example of the logistic equation. This equation is used as a simple model for…
A: We are given the logistic equation is, . For (a), We…
Q: The population (p) of a small community on the outskirts of a city grows rapidly over a 20- year…
A: Use the excel to find the exponential model as follows. Step 1: First type the data in excel as…
Q: age (years) Cumulative percent sexually active 15 16.6 16 28.7 17 47.9 18 64.0 19 77.6 20 83.0 The…
A:
Q: Which of the following model approaches would best suit a model predicting the efficacy of a new…
A: Ordered logit
Q: Find the formula for logistic growth using the given information. (Use t as your variable.) The…
A: Consider the given information.
Q: 90 The logistic growth function P(x)= 1+271 -0.122x models the percentage, P(x), of Americans who…
A: Given :Px=901+271e-0.122x
Q: Given the logistic growth model: N(t) = k / 1 + be^-rt Which statement below is false? a)…
A: Option (e) is false. Consider the graph for the logistic growth model. The plot for logistic growth…
Q: a scuba diver used her camera equipment to measure the intensity of light, in lux, as she dove into…
A: Use the given data to form the excel table: x y ln x ln^2 (x) y*ln x y = a + b*lnx 5 2.3…
Q: Indicate whether the following are true or false. Explain true or false. a. If the explained…
A: We have given that the statement about to the logistic regression. Here, need to find out the given…
Q: Use your calculator to determine the exponential regression equation that models the set of data…
A:
Q: When discussing MKT 317 with your classmates, you hear "Reading assignments take so much time, but…
A: Let's find.
Q: In the figure below a logistic growth curve is sketched. Estimate the optimum yield level and the…
A: Given is the logistic growth curve. The objective is to determine the optimum yield level and the…
Q: what are the blanks
A: Calculation: a)Determine the introduced number of foxes as follows.Substitute t =0 in the given…
Q: The graph shown represents population growth. Time (years) A. exponential (J-curve) B. negative D.…
A: Exponential growth occurs when the resources are sufficiently enough and logistic growth occurs when…
Q: pre calc question in the image file
A:
Q: Population of bears modeled by logistic model dp 0.008p(100 – p). What is the inflection point of p?…
A:
Q: The table below shows value of a car purchased in 2002. Years since 4 2002 16,000 5,754 Without…
A:
Q: The fox population in a certain region has an annual growth rate of 6% per year. In the year 2012,…
A: Given The fox population in a certain region has an annual growth rate of 6% per year. In the year…
Q: Make an exponential model y(t) with the given properties. Assume that t is the number of perfods.…
A:
Q: A graphing calculator is recommended. The relative growth rate of the world population has been…
A:
Q: After how many years will the population be 253? Round to the nearest year.
A: Given- P(t) = 3001+14e-0.157t⇒ 1+14e-0.157t = 300P(t)⇒ 14e-0.157t = 300P(t) - 1⇒ e-0.157t = 300P(t)…
Q: There are currently 1,000 cases of Venusian flu in a total susceptible population of 10,000, and the…
A:
Q: Using Sherie's data, find the best-fit exponential equation for this growth, through both the…
A: Solution:
Q: A study of Maryland's portion of Chesapeake Bay found the following information about stocks of…
A: (a). Find the logistic model N(t): Here, the initial value is I = 218. Carrying capacity is M =…
Q: In one country the average consumer drank four servings of Coca-Cola in 1993. This amount appeared…
A:
Q: 103,000 The logistic growth function f(t) = describes the number of people, f(t), who have become…
A: Let's find.
Q: 1000 t2 0 1 + 9e-kt'
A: p=10001+9e-kt, t≥0 Also given that herd size is 156 after 2 years. That is when t=2, p=156.
Q: Use exponential regression to find an exponential function that best fits this data. f(x) = Use…
A: Answer is in next step.
Q: Yearly log production in units was regressed against time where t = 1 in 2015. This resulted in the…
A:
Q: Measured real wages understate living standards because O The CPI overstates growth Wages ignore…
A:
Q: A sample of bacteria taken from a river has an initial concentration of 2.1 million b. (a) Find an…
A: Here we have, The initial concentration of the bacteria = 2.1 million bacteria per milliliter. and…
Q: A nation's population (to the nearest million) was 281 million in 2000 and 311 in 2010. It is…
A: Solve for given conditions
Q: 90 The logistic growth function P(x) = models the percentage, P(x), of Americans who are x years old…
A:
Q: Assume that a population is growing initially at the specified rate. A value for P, is given. Use…
A:


Trending now
This is a popular solution!

Step by step
Solved in 2 steps with 3 images

- Special Rounding Instructions When you perform logistic regression, round the r value to three decimal places and the other parameters to two decimal places. Round all answers to two decimal places unless other-wise indicated. Fluorescent Bulbs Compact fluorescent light bulbs save energy when compared with traditional incandescent bulbs. Our green energy campaign includes efforts to get local residents to exchange their incandescent bulbs fur fluorescent bulbs. Initially 200 households make the change. Market studies suggest that, in the absence of limiting factors, we could increase that number by 25 each month. In our target area, there are 250,000 households, which we take as the limiting value. Make a logistic model that gives the number of households converting to fluorescent bulbs after t months.Special Rounding instructions When you perform logistic regression, round the r value to three decimal places and other parameters to two decimal places. Round all answers to two decimals places unless otherwise indicated. Ebola Figure 5.14 shows a plot of the total number E of Ebola cases in West Africa reported to the centers for Diseases control and Prevention from April 1, 2014, through December 1, 2015. A logistic fit for these data is given by, E=27,841.421+134.65e0.646t. Where t is the time in months since April 1, 2014. In figure 5.15, we have added the graph of this model. a.Does Figure 5.14 show a continuing epidemic or a health crisis that is under control by December 2015? b.According to the model, what was the total number of cases when the disease was spreading at the fastest rate? Round your answer to the nearest whole number. c.Use the crossing- graphs method to determine when the disease was growing at the fastest rate. Round your answer, in months, to one decimal place.Special Rounding Instructions When you perform logistic regression, round the r value to three decimal places and the other parameters to two decimal places. Round all answers to two decimal places unless other-wise indicated. Natural Gas Production The following table shows natural gas production N in trillions of cubic feet in the United states t years after 1940. t=yearssince1940 N=cubicft.intrilliions 0 3.75 10 8.48 20 15.09 30 23.79 40 21.87 50 21.52 60 24.15 a. Make a logistic model for N as a function of t. b. Graph the data and the logistic model. c. Which years production was farthest from the prediction of the logistic model? d. What does the logistic model predict for the amount of natural gas that will be produced in the long run? Note: In other contexts, this would be known as the carrying capacity..
- Sales of a video game released in the year 2000 took off at first, but then steadily slowed as time moved on. Table 4 shows the number of games sold, in thousands, from the years 20002010. a. Let x represent time in years starting with x=1 for the year 2000. Let y represent the number of games sold in thousands. Use logarithmic regression to fit a model to these data. b. If games continue to sell at this rate, how many games will sell in 2015? Round to the nearest thousand.Special Rounding Instructions For this exercise set, round all regression parameters to three decimal places, but round all other answers to two decimal places unless otherwise indicated. Rare Coins The table below shows the estimated value C, in dollars, of an 1877 Indian Head Cent Philadelphia mint mark in very fine condition t years after 1950. t=time,inyearssince1950 C=value,indollars 0 25 30 400 45 625 54 1750 60 2000 a.Use exponential regression to model C as an exponential function of t. b.According to your exponential model, by what percentage does the value of the 1877 cent increase from year to year?Special Rounding Instructions When you perform logistic regression, round the r value to three decimal places and the other parameters to two decimal places. Round all answers to two decimal places unless other-wise indicated. PTA Participation A school board has a plan to increase participation in the PTA. Currently only about 25 parents attend meetings. Suppose the school board plan results in logistic growth of attendance. The school board believes that its plan can eventually lead to an attendance level of 50 parents. In the absence of limiting factors, the school board believes that its plan can increase participation by 10 each month. Let m denote the number of months since the participation plan was put in place, and let P be the number of parents attending PTA meetings. a. What is the carrying capacity K for a logistic model of P versus m? b. Find the constant b for a logistic model. c. Find the r value for a logistic model. Round your answer to three decimal places. d. Find a logistic model for P versus m.
- World Population The following table shows world population N, in billions, in the given year. Year 1950 1960 1970 1980 1990 2000 2010 N 2.56 3.04 3.71 4.45 5.29 6.09 6.85 a. Use regression to find a logistic model for world population. b. What r value do these data yield for humans on planet Earth? c. According to the logistic model using these data, what is the carrying capacity of planet Earth for humans? d. According to this model, when will world population reach 90 of carrying capacity? Round to the nearest year. Note: This represents a rather naive analysis of world population.Special Rounding Instructions For this exercise set, round all regression parameters to three decimal places, but round all other answers to two decimal places unless otherwise indicated. Medicare ExpendituresThe following table is from the Centers for Medicare that is, M=1000?Special Rounding Instructions For this exercise set, round all regression parameters to three decimal places, but round all other answers to two decimal places unless otherwise indicated. First Down The following table shows the probability P, as a percentage, of a college football team converting on fourth down when not goal to go versus the distance D, in yards, to the first down maker. 28 D = distance, in yards P = probability 1 70 2 60 3 53 4 46 5 41 6 37 7 34 8 32 a.Use exponential regression to model the data. b.Plot the data along with the exponential model. c.What probability does the model give of gaining a first down for fourth down and 10yards to go? Note: the actual probability is 28.
- Cable TV The following table shows the number C. in millions, of basic subscribers to cable TV in the indicated year These data are from the Statistical Abstract of the United States. Year 1975 1980 1985 1990 1995 2000 C 9.8 17.5 35.4 50.5 60.6 60.6 a. Use regression to find a logistic model for these data. b. By what annual percentage would you expect the number of cable subscribers to grow in the absence of limiting factors? c. The estimated number of subscribers in 2005 was 65.3million. What light does this shed on the model you found in part a?Special Rounding Instructions When you perform logistic regression, round the r value to three decimal places and the other parameters to two decimal places. Round all answers to two decimal places unless other-wise indicated. African Bees There are 3600 commercial bee hives in a region threatened by African bees. Today African bees have taken over 50 hives. Experience in other areas shows that, in the absence of limiting factors, the African bees will increase the number of hives they take over by 30 each year. Make a logistic model that shows the number of hives taken over by African bees after t years, and determine how long it will be before 1800 hives are affected.Special Rounding Instructions For this exercise set, round all regression parameters to three decimal places, but round all other answers to two decimal places unless otherwise indicated. Cost of Scientific periodicals The table below shows the average cost C, in dollars, of chemistry and physics periodicals tyears after 1980. 29 t=yearssince1980 C=cost,indollars 0 140 5 250 10 410 15 780 20 1300 22 1520 a.Make an exponential model of C as a function of t. b.Plot the data and the exponential model. c.What was the yearly percentage growth rate of the cost of chemistry and physics periodicals? d.If this exponential trend continues, what will be the expected average cost of physics and chemistry periodicals in 2020? Round your answer to the nearest dollar.

