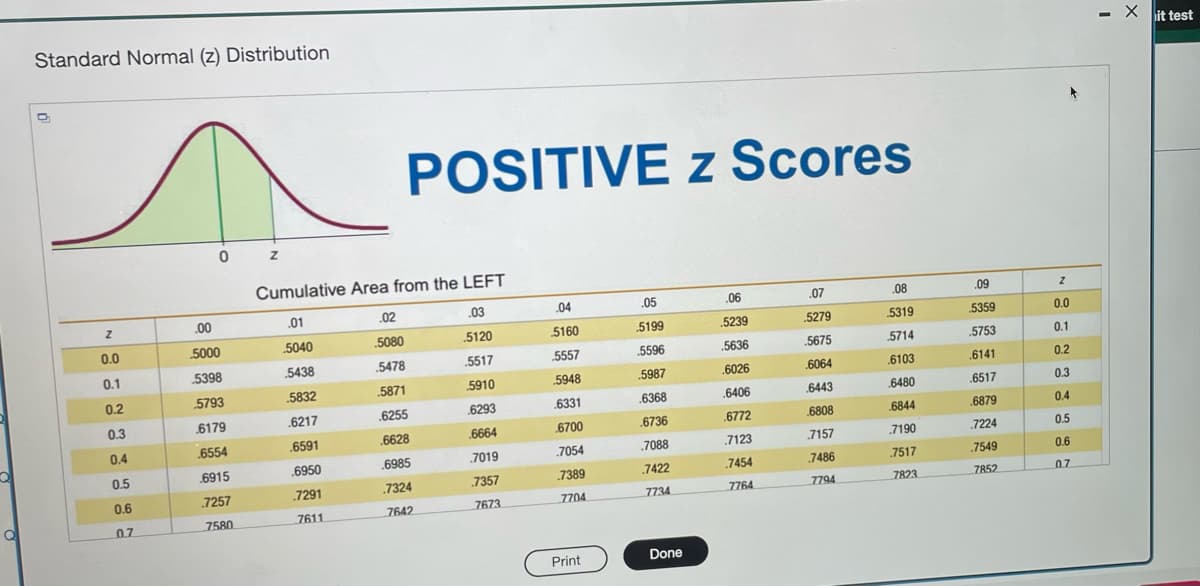
Use the sample data and confidence level given below to complete parts (a) through (d). A research institute poll asked respondents if they felt vulnerable to identity theft. In the poll, n=903 and x=595 who said "yes." Use a 95% confidence level. Click the icon to view a table of z scores. a) Find the best point estimate of the population proportion p. (Round to three decimal places as needed.) b) Identify the value of the margin of error E. E= (Round to three decimal places as needed.) c) Construct the confidence interval. 0
Use the sample data and confidence level given below to complete parts (a) through (d). A research institute poll asked respondents if they felt vulnerable to identity theft. In the poll, n=903 and x=595 who said "yes." Use a 95% confidence level. Click the icon to view a table of z scores. a) Find the best point estimate of the population proportion p. (Round to three decimal places as needed.) b) Identify the value of the margin of error E. E= (Round to three decimal places as needed.) c) Construct the confidence interval. 0

MATLAB: An Introduction with Applications
6th Edition
ISBN:9781119256830
Author:Amos Gilat
Publisher:Amos Gilat
Chapter1: Starting With Matlab
Section: Chapter Questions
Problem 1P

Related questions
Question
Transcribed Image Text:Q
Standard Normal (z) Distribution
D
Z
0.0
0.1
0.2
0.3
0.4
0.5
0.6
0.7
A.
0 Z
.00
5000
5398
5793
6179
6554
6915
.7257
7580
Cumulative Area from the LEFT
.03
5120
.5517
5910
6293
6664
.7019
7357
7673
.01
5040
5438
5832
.6217
.6591
.6950
.7291
7611
POSITIVE z Scores
.02
5080
5478
5871
.6255
.6628
.6985
.7324
7642
.04
5160
5557
5948
6331
6700
.7054
7389
7704
Print
.05
5199
5596
5987
6368
6736
.7088
.7422
7734
Done
.06
5239
5636
.6026
.6406
.6772
7123
.7454
7764
07
5279
5675
6064
6443
6808
.7157
7486
7794
.08
5319
5714
6103
6480
6844
7190
7517
7823
.09
5359
.5753
.6141
.6517
.6879
7224
.7549
7852
Z
0.0
0.1
0.2
0.3
0.4
0.5
0.6
0.7
-Xit test
Transcribed Image Text:Use the sample data and confidence level given below to complete parts (a) through (d).
K
A research institute poll asked respondents if they felt vulnerable to identity theft. In the poll, n=903 and x = 595 who said "yes." Use a 95% confidence level.
Click the icon to view a table of z scores.
a) Find the best point estimate of the population proportion p
(Round to three decimal places as needed.)
b) Identify the value of the margin of error E.
E=0
(Round to three decimal places as needed.)
c) Construct the confidence interval.
0<P<0
(Round to three decimal places as needed.)
d) Write a statement that correctly interprets the confidence interval. Choose the correct answer below.
O A. 95% of sample proportions will fall between the lower bound and the upper bound.
OB. One has 95% confidence that the interval from the lower bound to the upper bound actually does contain the true value of the population proportion.
OC. One has 95% confidence that the sample proportion is equal to the population proportion.
OD. There is a 95% chance that the true value of the population proportion will fall between the lower bound and the upper bound.
Expert Solution
This question has been solved!
Explore an expertly crafted, step-by-step solution for a thorough understanding of key concepts.

Step by step
Solved in 6 steps with 14 images

Recommended textbooks for you
MATLAB: An Introduction with Applications
Statistics
ISBN:
9781119256830
Author:
Amos Gilat
Publisher:
John Wiley & Sons Inc

Probability and Statistics for Engineering and th…
Statistics
ISBN:
9781305251809
Author:
Jay L. Devore
Publisher:
Cengage Learning

Statistics for The Behavioral Sciences (MindTap C…
Statistics
ISBN:
9781305504912
Author:
Frederick J Gravetter, Larry B. Wallnau
Publisher:
Cengage Learning
MATLAB: An Introduction with Applications
Statistics
ISBN:
9781119256830
Author:
Amos Gilat
Publisher:
John Wiley & Sons Inc
Probability and Statistics for Engineering and th…
Statistics
ISBN:
9781305251809
Author:
Jay L. Devore
Publisher:
Cengage Learning
Statistics for The Behavioral Sciences (MindTap C…
Statistics
ISBN:
9781305504912
Author:
Frederick J Gravetter, Larry B. Wallnau
Publisher:
Cengage Learning

Elementary Statistics: Picturing the World (7th E…
Statistics
ISBN:
9780134683416
Author:
Ron Larson, Betsy Farber
Publisher:
PEARSON

The Basic Practice of Statistics
Statistics
ISBN:
9781319042578
Author:
David S. Moore, William I. Notz, Michael A. Fligner
Publisher:
W. H. Freeman

Introduction to the Practice of Statistics
Statistics
ISBN:
9781319013387
Author:
David S. Moore, George P. McCabe, Bruce A. Craig
Publisher:
W. H. Freeman