Use the Spearman's rank correlation test to determine whether a significant degree of positive rank correlation exists, using a = 0.1 as the desired significance level. Clearly state the conclusion to your hypothesis test. Use Spearman's Rank Correlation Test (a = 10%) to test the hypothesis %3D
Use the Spearman's rank correlation test to determine whether a significant degree of positive rank correlation exists, using a = 0.1 as the desired significance level. Clearly state the conclusion to your hypothesis test. Use Spearman's Rank Correlation Test (a = 10%) to test the hypothesis %3D

Glencoe Algebra 1, Student Edition, 9780079039897, 0079039898, 2018
18th Edition
ISBN:9780079039897
Author:Carter
Publisher:Carter
Chapter10: Statistics
Section10.3: Measures Of Spread
Problem 1GP

Related questions
Question
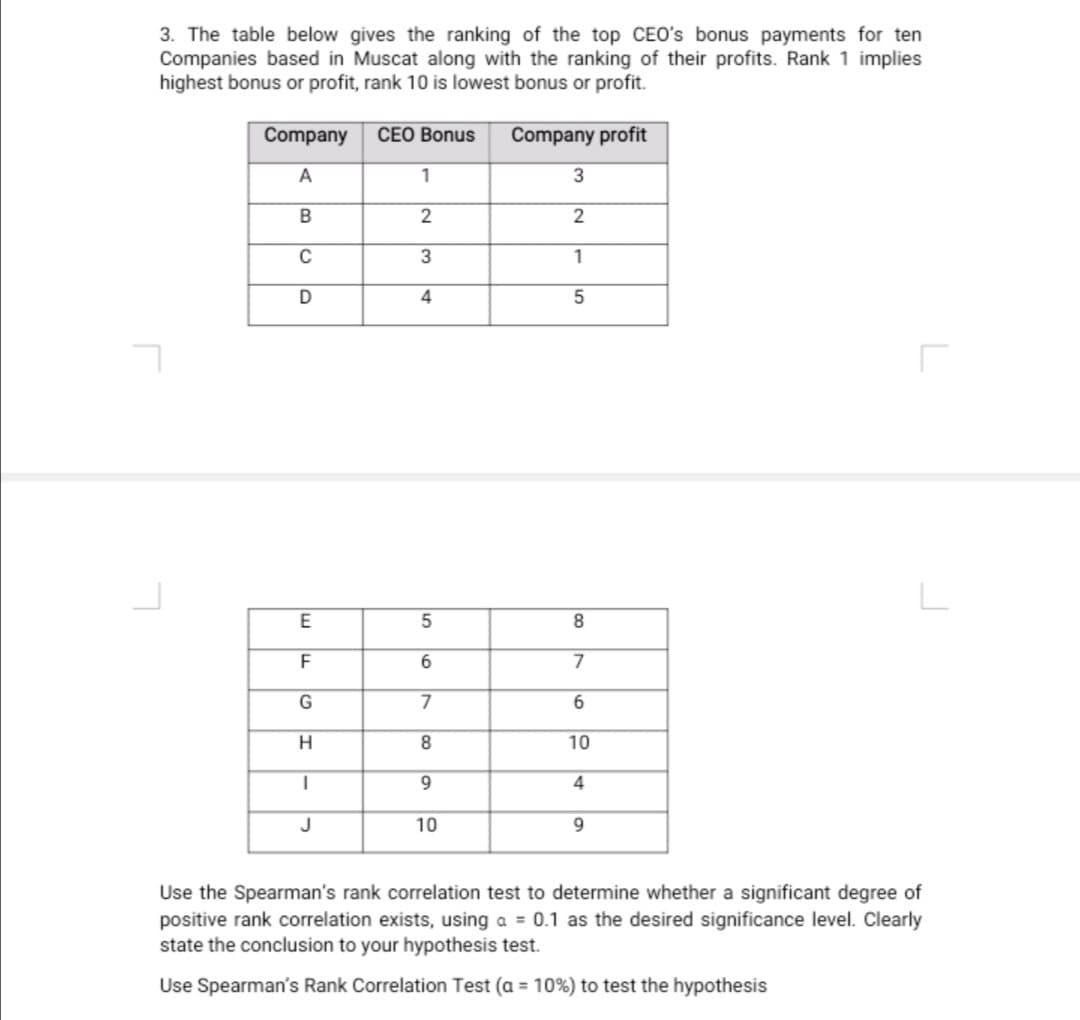
Transcribed Image Text:3. The table below gives the ranking of the top CEO's bonus payments for ten
Companies based in Muscat along with the ranking of their profits. Rank 1 implies
highest bonus or profit, rank 10 is lowest bonus or profit.
Company
CEO Bonus
Company profit
A
1
3
2
C
3
1
4
E
F
H.
8.
10
J
10
9.
Use the Spearman's rank correlation test to determine whether a significant degree of
positive rank correlation exists, using a = 0.1 as the desired significance level. Clearly
state the conclusion to your hypothesis test.
Use Spearman's Rank Correlation Test (a = 10%) to test the hypothesis
Expert Solution
This question has been solved!
Explore an expertly crafted, step-by-step solution for a thorough understanding of key concepts.

Step by step
Solved in 2 steps

Knowledge Booster


Learn more about
Need a deep-dive on the concept behind this application? Look no further. Learn more about this topic, statistics and related others by exploring similar questions and additional content below.Recommended textbooks for you
Glencoe Algebra 1, Student Edition, 9780079039897…
Algebra
ISBN:
9780079039897
Author:
Carter
Publisher:
McGraw Hill
Glencoe Algebra 1, Student Edition, 9780079039897…
Algebra
ISBN:
9780079039897
Author:
Carter
Publisher:
McGraw Hill