. Calculate the correlation coefficient. 2. What do these data indicate about the height of the initial drop of a roller coaster and the duration of the ride? O A. Generally, rides on coasters with a greater initial drop tend to last somewhat shorter, because the correlation indicates a moderate association. O B. Generally, rides on coasters with a greater initial drop tend to last longer, because the correlation indicates a strong association. O C. Generally, rides on qpasters with a greater initial drop tend to last somewhat longer, because the correlation indicates a moderate association. O D. Generally, rides on coasters with a greater initial drop tend to last somewhat longer, because the correlation indicates a weak association.


1. Calculate the
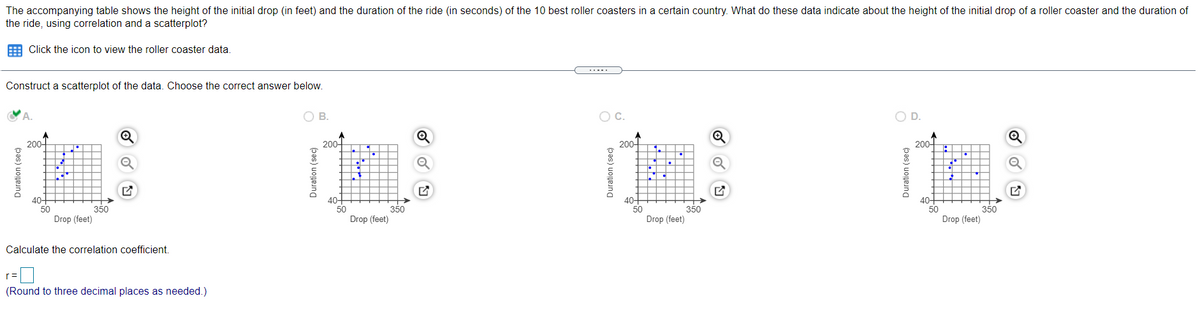
2. What do these data indicate about the height of the initial drop of a roller coaster and the duration of the ride?
O A. Generally, rides on coasters with a greater initial drop tend to last somewhat shorter, because the correlation indicates a moderate association.
O B. Generally, rides on coasters with a greater initial drop tend to last longer, because the correlation indicates a strong association.
O C. Generally, rides on qpasters with a greater initial drop tend to last somewhat longer, because the correlation indicates a moderate association.
O D. Generally, rides on coasters with a greater initial drop tend to last somewhat longer, because the correlation indicates a weak association.


Trending now
This is a popular solution!

Step by step
Solved in 3 steps with 1 images

