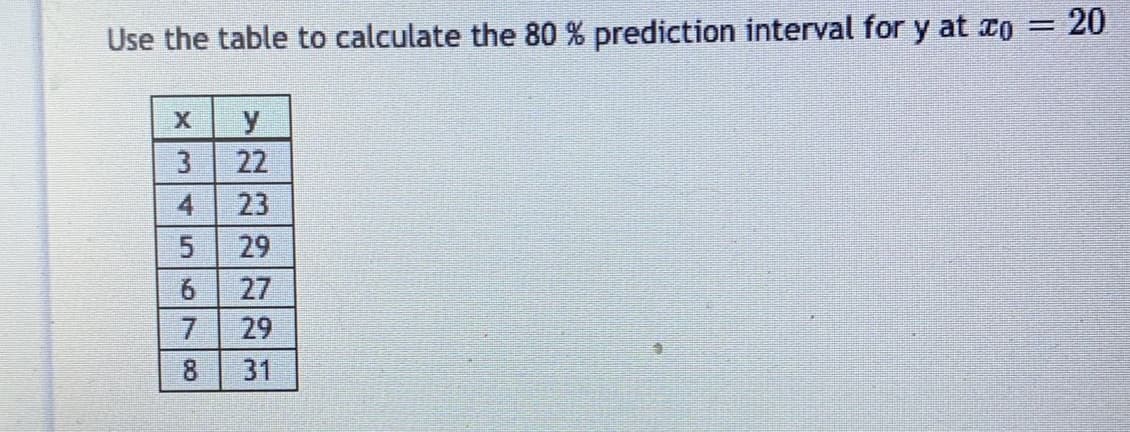
Use the table to calculate the 80 % prediction interval for y at zo = 20 3 22 4 23 29 27 29 8. 31


Q: values is the 90th percentile of the t-distribution with 10 degrees of freedom? a. 1.363…
A: According to the central limit theorem, the sampling distribution of the sample scores follows the…
Q: Find the value of t0.005 for a t-distribution with 28 degrees of freedom.
A:
Q: Calculate the 70th percentile of the data shown x 4.2 5 6.7 12.4 13.1 20 21.9 23.3 29.6
A: The pth percentile of a set of observations is the value below which, p% or (p/100) proportion of…
Q: 5) Combine the dataX and Y and let's say the data set Z. b) Calculate the 7Oth percentile of the…
A: Given : xx = 02 After combining the data : These are the sample data that have been provided:…
Q: What is the 90th percentile in a t-distribution with 12 degrees of freedom? a. 1.356 b. 1.796 c.…
A: The kth percentile implies the value, below which k of the total observations lie.
Q: Find each of the requested values for the distribution shown in the following table. (d) What is…
A: Given data is appropriate for measures of dispersion to find the percentile for the given data . But…
Q: Find each of the requested values for the distribution shown in the following table. (a) What score…
A: Percentile Rank (PR): It is the measure of the relative performance, where it is the percentage of…
Q: What is the Variance of a geometric distribution having parameter p-0.24? Select one: a. 4.167 b.…
A: We have find variance distribution...
Q: Use the Empirical Rule to find the 95% range and find the percentage of data points in that range.…
A: Given data is5,6,3,3,4,2,7,8,9,2,5,4,3,11,21,31,22,27,28,18
Q: The quarterly returns for a group of 66 mutual funds with a mean of 3.1% and a standard deviation of…
A: Note: Hi, thank you for the question. As per our company guideline we are supposed to answer only…
Q: In the Quantitative Methods course test taken by 15 students, following is the score out of 100…
A: The following data is the test scores out of 100 taken by students in Quantitative Methods course…
Q: Derive the mean and variance of the t distribution.
A: Given that We have to derive the mean and variance of t distribution:
Q: The list below shows the marks for 20 students on a recent test out of 42. 40 28 28 30 20 25 38 40…
A: Given data: 40,28,28,30,20,25,38,40,26,10,36,25,42,21,34,37,30,23,24,36 Arrange in ascending order…
Q: Lucas recorded his lunch expenditure each day for one week in the table below. Day Sunday Monday…
A:
Q: Find the 1st quartile, 7th decile, 35th percentile, and percentile rank of 115 and 155 for the…
A:
Q: The monthly closing stock prices ( rounded to the nearest dollar) for Panera Bread Co. for the…
A: We have given that data 71 73 76 78 81 75 I want to find sample variance ( s2 )
Q: Calculate Karl Pearson's Measure of Skewness on the basis of Mean, Mode and Standard Deviation. 14.5…
A:
Q: Complete the table below and solve for: a) Variance of the sampling distribution b) Standard…
A:
Q: For a sample with M = 10 and s = 2, a score of X = 13 would be considered an extreme score, far out…
A: According to range rule thumb if any observation is less than M – 2s, or greater than M + 2s, then…
Q: from the following data : Calculate the quartile deviation and its coefficient Months Мonthly…
A:
Q: When employing a univariate credit analysis, using times interest earned(TIE)as a predictor of…
A: According to the provided information,
Q: Assume the temperature inside a growth chamber fluctuates randomly, and you would like to estimate…
A: Given data, 69.6,59.5,76.1,71.4,64.8,62.5,79.6,71.5,64.3 Sample mean is =∑xn=619.39=68.81 Sample…
Q: In a regression analysis, the coefficient of determination value is 0.804. What is the value for…
A: Given problem is :
Q: Determine the percentage of variation in the observed values of the response variable that is…
A: We have given that, The independent variable X and dependent variable Y is, X :- 25.9 31.5…
Q: The following table reports the sale of umbrellas for 16 quarters. Year 1 Year 3 Year 4 Quarter Year…
A: Introduction: The sale of umbrellas is the response variable, and the year and quarters are the…
Q: Calculate the 30th percentile of the data shown x 2.5 4.4 5.7 7 7.6 8.1 17.8 21.2 23.9 27.8
A: The ascending order of the data is, x 2.5 4.4 5.7 7 7.6 8.1 17.8…
Q: X• P(X) X2 X² · P(X) X P(X) 0.04 1 0.38 0.11 3 0.07 4 0.40
A: Solution-: We have following table: X P(X) 0 0.04 1 0.38 2 0.11 3 0.07 4 0.4 We…
Q: The data below are concerning the concentration of thiol in the blood lysate. 1.84 1.92 1.94 1.92…
A: A) The data below are concerning the concentration of thiol in the blood lysate. 1.84 1.92 1.94 1.92…
Q: Show first the Mean, Median and Mode using Frequency Distribution. Solve for Q, P88, D10, Variance,…
A: From the provided , following table is constructed : Frequency : It is the number of times a value…
Q: Find the variance and standard deviation of each probability distribution below. 2 3 P(X) 0.1 0.45…
A:
Q: Calculate the 70th percentile of the data shown x 1 4.3 6 8 20.5 23.3 23.6 25 26.7 29.8
A:
Q: Find the variance, mean, and standard deviation for n = 300 and p = 0.30 when the conditions for the…
A: We have given that p = 0.30, n = 300 The pmf of Binomial distribution is P(X=x) = nCx*px(1-p)n-x…
Q: b. Calculate the 50th percentile. invNorm(.50, 28.7, 2.1) = 28.7 c. Calculate the 81st percentile.…
A: Given data: 28.7,2.1
Q: 1. Determine the 15t™ percentile of the waiting times of the sample of café customers presented in…
A: 1 Data is 7,8,8,9,9,9,9,9,10,10,10,11,12,14,14,15 n = 16 , k ( the percentile ) = 15% k ×n = 0.15…
Q: if its 80th percentile is the value 160, what is the value that corresponds to its 20th percentile
A: Given, Mean, μ = 140 80th percentile is the value 160. x = 160
Q: a. Obtain the cdf of X. b. What is P(X ≤ .5)? c. Using the cdf from (a), what is P(.25 < X ≤ .5)?…
A: we have the pdf, f(x) = 90x8(1-x)= 90(x8-x9) for 0<x<1 we want to find, a. Obtain the cdf of…
Q: % percent of households x 0 1 2 3 4 5 % 3 11 28 39 12 7 Compute the mean of the distribution 1.28…
A:
Q: Calculate the 25th percentile of the data shown x 1.8 2.3 6.7 11.3 16.7 25.2 26.9 27.9
A: Arrange the data in ascending order to find the percentiles. 1.8,2.3,6.7,11.3,16.7,25.2,26.9,27.9…
Q: The following data are the monthly salaries and the grade point averages for students who obtained a…
A:
Q: In the Quantitative Methods course test taken by 15 students, following is the score out of 100…
A: Mean is given by, Mean=(summation Xi)/n Here n= 14 Mean=…
Q: Find the percentile for the data value. Data set: 3 13 10 6 3 3 13 6 3 13 2…
A: Given : Data set: 3 13 10 6 3 3 13 6 3 13 2 13 15 4 9 3 12 10…
Q: The Credit Risk Department of a major bank estimates the default rate on loans under $10,000 to be…
A: Given: Population proportion (p) = 4% = 0.04 Number of loans that will be made (n) = 2400
Q: Find the mean deviation about median for the followin distribution : x: 5 f: 9 11 13 15 17 2 4 6 8…
A:
Q: : Calculate the coefficient of skewness for the follow- ing distribution : Central value : 1 2 3 4 6…
A: Given data is Central value 1 2 3 4 5 6 7 8 9 10 Frequency 2 9 11 14 20 24 20 16 5 5
Q: Consider the distribution below. Compute for the mean and variance. X 0 10 20 30 40 50 P(x) 5% 5%…
A: According to the given information, we have The probability distribution table is given. X 0 10…
Q: he five-number summary for a dataset on Grade Point Average is given in the table below. Using this…
A: I have shown the box-plot
Q: The data below give the ages of a random sample of 17 students. Calculate the percentile rank of 38…
A: First arrange the data in ascending order 28 33 36 36 37 38 40 41 41 41 41…

The 80% prediction interval for the value of y at x0=20 is between and

Step by step
Solved in 2 steps


- b) Find the critical value of t for a 90% confidence interval with df=58.With α = .05, what is the critical t value for a one-tailed test with n = 15? a. t = 1.761 c. t = 2.145 b. t = 1.753 d. t = 2.131Use the standard error to construct a approximate prediction interval for Y using an alpha of 5%. (Round your answer to 3 decimal places.) Obs Assessed Floor Offices Entrances Age Freeway 1 1796 4790 4 2 8 0 2 1544 4720 3 2 12 0 3 2094 5940 4 2 2 0 4 1968 5720 4 2 34 1 5 1567 3660 3 2 38 1 6 1878 5000 4 2 31 1 7 949 2990 2 1 19 0 8 910 2610 2 1 48 0 9 1774 5650 4 2 42 0 10 1187 3570 2 1 4 1 11 1113 2930 3 2 15 1 12 671 1280 2 1 31 1 13 1678 4880 3 2 42 1 14 710 1620 1 2 35 1 15 678 1820 2 1 17 1 16 1585 4530 2 2 5 1 17 842 2570 2 1 13 0 18 1539 4690 2 2 45 0 19 433 1280 1 1 45 1 20 1268 4100 3 1 27 0 21 1251 3530 2 2 41 1 22 1094 3660 2 2 33 0 23 638 1110 1 2 50 1 24 999 2670 2 2 39 1 25 653 1100 1 1 20 1 26 1914 5810 4 3 17 0 27 772 2560 2 2 24 0 28 890 2340 3 1 5 0 29 1282 3690 2 2 15 1 30 1264 3580 3 2 27 0 31 1162 3610 2 1 8 1 32 1447 3960 3 2 17 0
- Consider a linear regression model for the decrease in blood pressure (mmHg) over a four-week period with muy=2.8+0.8x and standard deviation chi=3.2. The explanatory variable x is the number of servings fruits and vegetables in a calorie-controlled diet. Using the 68-95-99.7 rule, between what two values would approximately 95% of the observed responses, y, fall when x = 7?A major credit card company is interested in whether there is a linear relationship between its internal rating of a customer’s credit risk and that of an independent rating agency. The company collected a random sample of 200 customers and used the data to test the claim that there is a linear relationship. The following hypotheses were used to test the claim. H0:β1=0Ha:β1≠0 The test yielded a t-value of 3.34 with a corresponding p-value of 0.001. Which of the following is the correct interpretation of the p-value? If the alternative hypothesis is true, the probability of observing a test statistic at least as extreme as 3.34 is 0.001. If the alternative hypothesis is true, the probability of observing a test statistic at least as extreme as 3.34 is 0.001. A If the alternative hypothesis is true, the probability of observing a test statistic of 3.34 or greater is 0.001. If the alternative hypothesis is true, the probability of observing a test statistic of 3.34 or greater…For 50 randomly selected speed dates, attractiveness ratings by males of their female date partners (x) are recorded along with the attractiveness ratings by females of their male date partners (y); the ratings range from 1 to 10. The 50 paired ratings yield x=6.3, y=6.0, r=−0.264, P-value=0.063, and y=7.92−0.304x. Find the best predicted value of y (attractiveness rating by female of male) for a date in which the attractiveness rating by the male of the female is x=4. Use a 0.01 significance level. The best predicted value of y when x=4 is __ (Round to one decimal place as needed.)
- For 50 randomly selected speed dates, attractiveness ratings by males of their female date partners (x) are recorded along with the attractiveness ratings by females of their male date partners (y); the ratings range from 1 to 10. The 50 paired ratings yield x=6.3, y=6.0, r=−0.228, P-value=0.111, and y=7.81−0.280x. Find the best predicted value of y(attractiveness rating by female of male) for a date in which the attractiveness rating by the male of the female is x=5. Use a 0.10 significance level. The best predicted value of ywhen x=5 is nothing. (Round to one decimal place as needed.)Here is a bivariate data set.xy182425915011737106295223812246 Find the correlation coefficient and report it accurate to four decimal places. r =Test the null hypothesis that the slope is zero versus the two-sided alternative in the following setting using the alpha=0.05 signifiance level. n=20, yhat=28.5+1.4x, and SEb1=0.65
- As a bonus assignment a former student checked if your professor gave a statisticallysignificant difference in grades between his male and female students. She based herstudy based on grades assigned in intermediate Econ courses (Econ 303, 305 and 317)and her sample included nm = 485 male students and nf = 264 female students. Theaverage grades received were xm = 84.6 and xf = 85.8 The population standad deviation were σ m = 12.0 and σ f = 11.4 8. From the same extra-credit study as in question 7 see above, this former student found that the proportion of female students in principle courses (Econ 203, 205) was ?̅? = 0.380, while the proportion of female students in intermediate courses (Econ 303, 305, 317) was ?̅? = 0.352. The principle courses sample size was np = 782, while the intermediate courses sample size was ni = 749. Test the hypothesis that female students are less in intermediate courses using a 90% confidence level and the p-value approach.If the value of Cronbach’s alpha is 0.07, it means ___________; a. Research instrument is not reliable b. Research instrument is internally consistent c. Data is reliable d. Data is internally consistentFor 50 randomly selected speed dates, attractiveness ratings by males of their female date partners (x) are recorded along with the attractiveness ratings by females of their male date partners (y); the ratings range from 1 to 10. The 50 paired ratings yield x=6.3, y=5.9, r=−0.256, P-value=0.073, and y=7.73−0.285x. Find the best predicted value of y (attractiveness rating by female of male) for a date in which the attractiveness rating by the male of the female is x=6. Use a 0.01 significance level. The best predicted value of y when x=6 is?