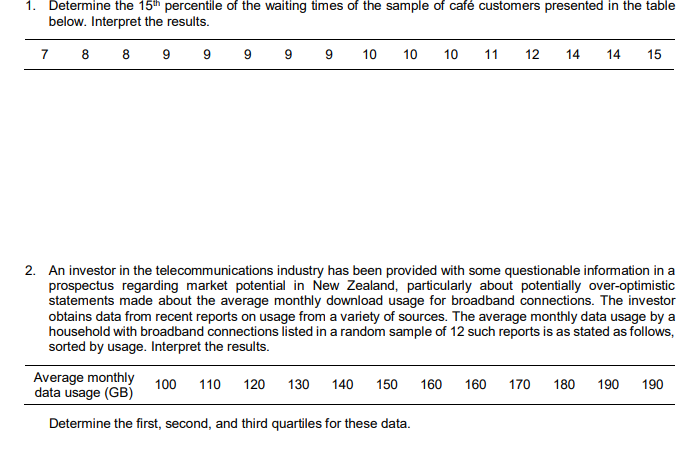
1. Determine the 15t™ percentile of the waiting times of the sample of café customers presented in the table below. Interpret the results. 7 8 8 9 9 10 10 10 11 12 14 14 15

Glencoe Algebra 1, Student Edition, 9780079039897, 0079039898, 2018
18th Edition
ISBN:9780079039897
Author:Carter
Publisher:Carter
Chapter10: Statistics
Section10.3: Measures Of Spread
Problem 1GP
icon
Related questions
icon
Concept explainers
Topic Video
Question
1. Determine the 15th percentile of the waiting times of the sample of café customers presented in the table
below. Interpret the results.
8 8 9
7
9
9
9
9
10
10
10
11
12
14
14
15
2. An investor in the telecommunications industry has been provided with some questionable information in a
prospectus regarding market potential in New Zealand, particularly about potentially over-optimistic
statements made about the average monthly download usage for broadband connections. The investor
obtains data from recent reports on usage from a variety of sources. The average monthly data usage by a
household with broadband connections listed in a random sample of 12 such reports is as stated as follows,
sorted by usage. Interpret the results.
Average monthly 100 110 120 130 140 150 160
data usage (GB)
160
170
180
190
190
Determine the first, second, and third quartiles for these data.
Transcribed Image Text:1. Determine the 15th percentile of the waiting times of the sample of café customers presented in the table below. Interpret the results. 8 8 9 7 9 9 9 9 10 10 10 11 12 14 14 15 2. An investor in the telecommunications industry has been provided with some questionable information in a prospectus regarding market potential in New Zealand, particularly about potentially over-optimistic statements made about the average monthly download usage for broadband connections. The investor obtains data from recent reports on usage from a variety of sources. The average monthly data usage by a household with broadband connections listed in a random sample of 12 such reports is as stated as follows, sorted by usage. Interpret the results. Average monthly 100 110 120 130 140 150 160 data usage (GB) 160 170 180 190 190 Determine the first, second, and third quartiles for these data.
Expert Solution
steps

Step by step

Solved in 2 steps

Blurred answer
Knowledge Booster
Centre, Spread, and Shape of a Distribution
Learn more about
Need a deep-dive on the concept behind this application? Look no further. Learn more about this topic, statistics and related others by exploring similar questions and additional content below.
Recommended textbooks for you
Glencoe Algebra 1, Student Edition, 9780079039897…
Algebra
ISBN:
9780079039897
Author:
Carter
Publisher:
McGraw Hill