Use the table to find the standard score and percentile of the following data values. a. A data value 1.8 standard deviations below the mean. b. A data value 1 standard deviation below the mean. c. A data value 0.6 standard deviation above the mean. E Click the icon to view the standard scores and percentiles for a normal distribution. a. The standard soore is and the percentile is (Type integers or decimals.) b. The standard score is and the percentile is (Type integers or decimals.) and the percentile is c. The standard score is (Type integers or decimals.)
Use the table to find the standard score and percentile of the following data values. a. A data value 1.8 standard deviations below the mean. b. A data value 1 standard deviation below the mean. c. A data value 0.6 standard deviation above the mean. E Click the icon to view the standard scores and percentiles for a normal distribution. a. The standard soore is and the percentile is (Type integers or decimals.) b. The standard score is and the percentile is (Type integers or decimals.) and the percentile is c. The standard score is (Type integers or decimals.)

Glencoe Algebra 1, Student Edition, 9780079039897, 0079039898, 2018
18th Edition
ISBN:9780079039897
Author:Carter
Publisher:Carter
Chapter10: Statistics
Section10.4: Distributions Of Data
Problem 22PFA

Related questions
Question
100%
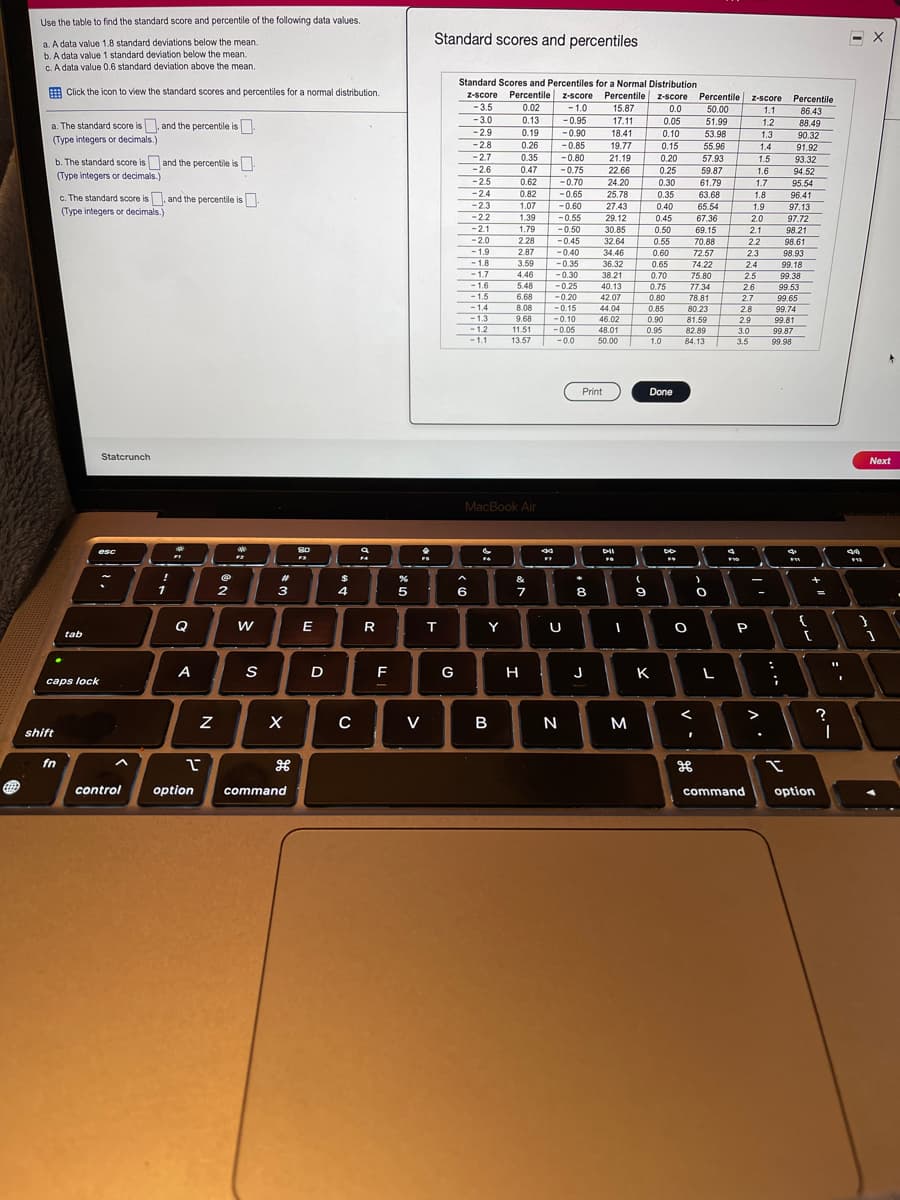
Transcribed Image Text:Use the table to find the standard score and percentile of the following data values.
Standard scores and percentiles
a. A data value 1.8 standard deviations below the mean.
b. A data value 1 standard deviation below the mean.
c. A data value 0.6 standard deviation above the mean.
Standard Scores and Percentiles for a Normal Distribution
E Click the icon to view the standard scores and percentiles for a normal distribution.
Z-score
Z-score Percentile
15.87
17.11
18.41
19.77
Z-score Percentile
50.00
51.99
53.98
Z-score
Percentile
0.02
0.13
0.19
-3.5
- 1.0
0.0
1.1
86.43
88.49
90.32
91.92
93.32
a. The standard score is, and the percentile is.
- 3.0
-0.95
0.05
1.2
-29
-2.8
-2.7
- 0.90
0.10
1.3
(Type integers or decimals.)
0.26
-0.85
-0.80
0.15
55.96
57.93
1.4
0.35
21.19
22.66
0.20
1.5
b. The standard score is and the percentile is
(Type integers or decimals.)
-2.6
0.47
-0.75
-0.70
0.25
59.87
1.6
94.52
95.54
96.41
97.13
97.72
98.21
98.61
98.93
-2.5
-2.4
0.62
24.20
0.30
61.79
1.7
0.82
0.35
-0.65
-0.60
-0.55
25.78
27.43
63.68
1.8
c. The standard score is, and the percentile is
(Type integers or decimals.)
-2.3
1.07
0.40
65.54
1.9
67.36
69.15
-22
1.39
1.79
29.12
30.85
0.45
2.0
-2.1
-0.50
0.50
2.1
-2.0
2.28
-0.45
32.64
34.46
0.55
70.88
2.2
- 1.9
2.87
-0.40
0.60
72.57
- 1.8
- 1.7
- 1.6
3.59
4.46
5.48
2.3
2.4
25
-0.35
36.32
38.21
0.65
74.22
99.18
-0.30
0.70
75.80
99.38
-0.25
40.13
42.07
44.04
46.02
48.01
50.00
0.75
77.34
2.6
99.53
-1.5
6.68
-0.20
0.80
78.81
2.7
99.65
- 1.4
-1.3
- 1.2
- 1.1
8.08
9.68
11.51
13.57
-0.15
2.8
29
0.85
80.23
99.74
-0.10
0.90
81.59
99.81
-0.05
0.95
82.89
3.0
99.87
-0.0
1.0
84.13
3.5
99.98
Print
Done
Statcrunch
Next
MacBook Air
So
esc
%23
&
2
3
4
6
Q
E
R
Y
P
{
tab
A
D
F
G
H
J
K
L
caps lock
>
V
M
shift
fn
control
option
command
command
option
Expert Solution
This question has been solved!
Explore an expertly crafted, step-by-step solution for a thorough understanding of key concepts.

This is a popular solution!

Trending now
This is a popular solution!

Step by step
Solved in 4 steps

Recommended textbooks for you
Glencoe Algebra 1, Student Edition, 9780079039897…
Algebra
ISBN:
9780079039897
Author:
Carter
Publisher:
McGraw Hill

Big Ideas Math A Bridge To Success Algebra 1: Stu…
Algebra
ISBN:
9781680331141
Author:
HOUGHTON MIFFLIN HARCOURT
Publisher:
Houghton Mifflin Harcourt
Glencoe Algebra 1, Student Edition, 9780079039897…
Algebra
ISBN:
9780079039897
Author:
Carter
Publisher:
McGraw Hill
Big Ideas Math A Bridge To Success Algebra 1: Stu…
Algebra
ISBN:
9781680331141
Author:
HOUGHTON MIFFLIN HARCOURT
Publisher:
Houghton Mifflin Harcourt