Use this data to calculate the mean WISC score, x, for these 40 students. Next, compute the standard deviation, SD, of the sampling distribution of the sample mean, assuming that the standard deviation of WISC scores for students in the district is the same as for the population as a whole. Finally, determine both the lower and upper limits of a 95% z-confidence interval for u, the mean score for all students in the school district who are enrolled in gifted and talented programs.
Use this data to calculate the mean WISC score, x, for these 40 students. Next, compute the standard deviation, SD, of the sampling distribution of the sample mean, assuming that the standard deviation of WISC scores for students in the district is the same as for the population as a whole. Finally, determine both the lower and upper limits of a 95% z-confidence interval for u, the mean score for all students in the school district who are enrolled in gifted and talented programs.

MATLAB: An Introduction with Applications
6th Edition
ISBN:9781119256830
Author:Amos Gilat
Publisher:Amos Gilat
Chapter1: Starting With Matlab
Section: Chapter Questions
Problem 1P

Related questions
Question
Can I get more clarification on the low end.
113.7 Is not correct.
| Score |
| 122 |
| 117 |
| 128 |
| 142 |
| 106 |
| 104 |
| 116 |
| 118 |
| 95 |
| 139 |
| 142 |
| 125 |
| 116 |
| 104 |
| 122 |
| 105 |
| 98 |
| 113 |
| 123 |
| 115 |
| 164 |
| 116 |
| 111 |
| 137 |
| 132 |
| 133 |
| 95 |
| 111 |
| 125 |
| 112 |
| 140 |
| 121 |
| 100 |
| 99 |
| 130 |
| 115 |
| 149 |
| 91 |
| 118 |
| 99 |
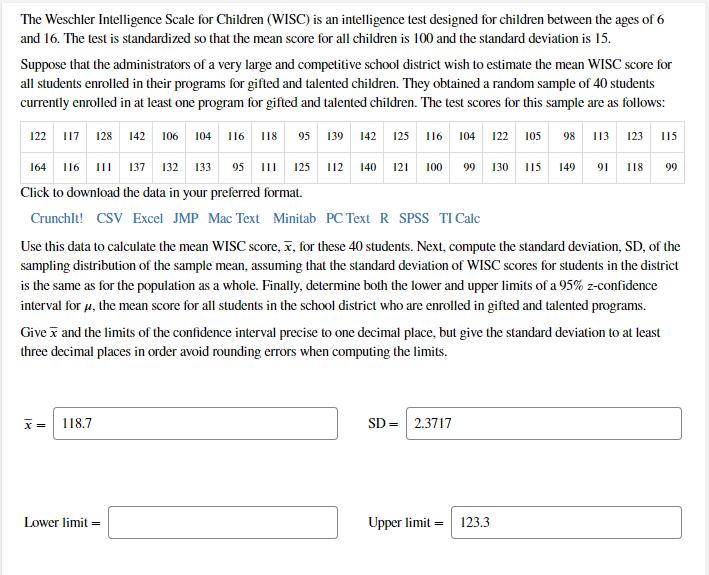
Transcribed Image Text:The Weschler Intelligence Scale for Children (WISC) is an intelligence test designed for children between the ages of 6
and 16. The test is standardized so that the mean score for all children is 100 and the standard deviation is 15.
Suppose that the administrators of a very large and competitive school district wish to estimate the mean WISC score for
all students enrolled in their programs for gifted and talented children. They obtained a random sample of 40 students
currently enrolled in at least one program for gifted and talented children. The test scores for this sample are as follows:
122 117 128 142 106 104
116
118
95 139 142 125 116 104 122 105
98 113
123
115
164
116
II
137 132 133
95
125
112
140
121
100
99
130
115
149
91
118
99
Click to download the data in your preferred format.
Crunchlt! CSV Excel JMP Mac Text Minitab PC Text R SPSS TI Calc
Use this data to calculate the mean WISC score, x, for these 40 students. Next, compute the standard deviation, SD, of the
sampling distribution of the sample mean, assuming that the standard deviation of WISC scores for students in the district
is the same as for the population as a whole. Finally, determine both the lower and upper limits of a 95% z-confidence
interval for u, the mean score for all students in the school district who are enrolled in gifted and talented programs.
Give x and the limits of the confidence interval precise to one decimal place, but give the standard deviation to at least
three decimal places in order avoid rounding errors when computing the limits.
118.7
SD = 2.3717
Lower limit =
Upper limit =
123.3
Expert Solution
This question has been solved!
Explore an expertly crafted, step-by-step solution for a thorough understanding of key concepts.

This is a popular solution!

Trending now
This is a popular solution!

Step by step
Solved in 2 steps

Knowledge Booster


Learn more about
Need a deep-dive on the concept behind this application? Look no further. Learn more about this topic, statistics and related others by exploring similar questions and additional content below.Recommended textbooks for you
MATLAB: An Introduction with Applications
Statistics
ISBN:
9781119256830
Author:
Amos Gilat
Publisher:
John Wiley & Sons Inc

Probability and Statistics for Engineering and th…
Statistics
ISBN:
9781305251809
Author:
Jay L. Devore
Publisher:
Cengage Learning

Statistics for The Behavioral Sciences (MindTap C…
Statistics
ISBN:
9781305504912
Author:
Frederick J Gravetter, Larry B. Wallnau
Publisher:
Cengage Learning
MATLAB: An Introduction with Applications
Statistics
ISBN:
9781119256830
Author:
Amos Gilat
Publisher:
John Wiley & Sons Inc
Probability and Statistics for Engineering and th…
Statistics
ISBN:
9781305251809
Author:
Jay L. Devore
Publisher:
Cengage Learning
Statistics for The Behavioral Sciences (MindTap C…
Statistics
ISBN:
9781305504912
Author:
Frederick J Gravetter, Larry B. Wallnau
Publisher:
Cengage Learning

Elementary Statistics: Picturing the World (7th E…
Statistics
ISBN:
9780134683416
Author:
Ron Larson, Betsy Farber
Publisher:
PEARSON

The Basic Practice of Statistics
Statistics
ISBN:
9781319042578
Author:
David S. Moore, William I. Notz, Michael A. Fligner
Publisher:
W. H. Freeman

Introduction to the Practice of Statistics
Statistics
ISBN:
9781319013387
Author:
David S. Moore, George P. McCabe, Bruce A. Craig
Publisher:
W. H. Freeman