Use two green points (triangle symbol) to connect the two black points (plus symbols) representing the consumption schedule after the change in taxes. Use two purple points (diamond symbol) to connect the two black points (plus symbols) representing the consumption schedule that would result from a tax increase through a variable tax. (Hint: As before, the consumption schedule must pass through one point on the left and one point on the right.) Hint: The new consumption schedule must pass through one point on the left and one point on the right. 50 REAL CONSUMER SPENDING (Billions of dollars) 10 8 + Consumption with Tax Increase through a Fixed Tax + Consumption with Tax Increase through a Variable Tax + + + + 20 40 60 REAL GDP (Billions of dollars) 80 100 (?) Use the new consumption line you just plotted to calculate the new total expenditure at two levels of real GDP and fill in the following table. GDP level (Billions of dollars) 10 90 Total Expenditure (Billions of dollars)
Use two green points (triangle symbol) to connect the two black points (plus symbols) representing the consumption schedule after the change in taxes. Use two purple points (diamond symbol) to connect the two black points (plus symbols) representing the consumption schedule that would result from a tax increase through a variable tax. (Hint: As before, the consumption schedule must pass through one point on the left and one point on the right.) Hint: The new consumption schedule must pass through one point on the left and one point on the right. 50 REAL CONSUMER SPENDING (Billions of dollars) 10 8 + Consumption with Tax Increase through a Fixed Tax + Consumption with Tax Increase through a Variable Tax + + + + 20 40 60 REAL GDP (Billions of dollars) 80 100 (?) Use the new consumption line you just plotted to calculate the new total expenditure at two levels of real GDP and fill in the following table. GDP level (Billions of dollars) 10 90 Total Expenditure (Billions of dollars)

Chapter18: The Keynesian Model
Section: Chapter Questions
Problem 9SQP

Related questions
Question
Hi hlo Expert pro Hand written solution is not allowed.
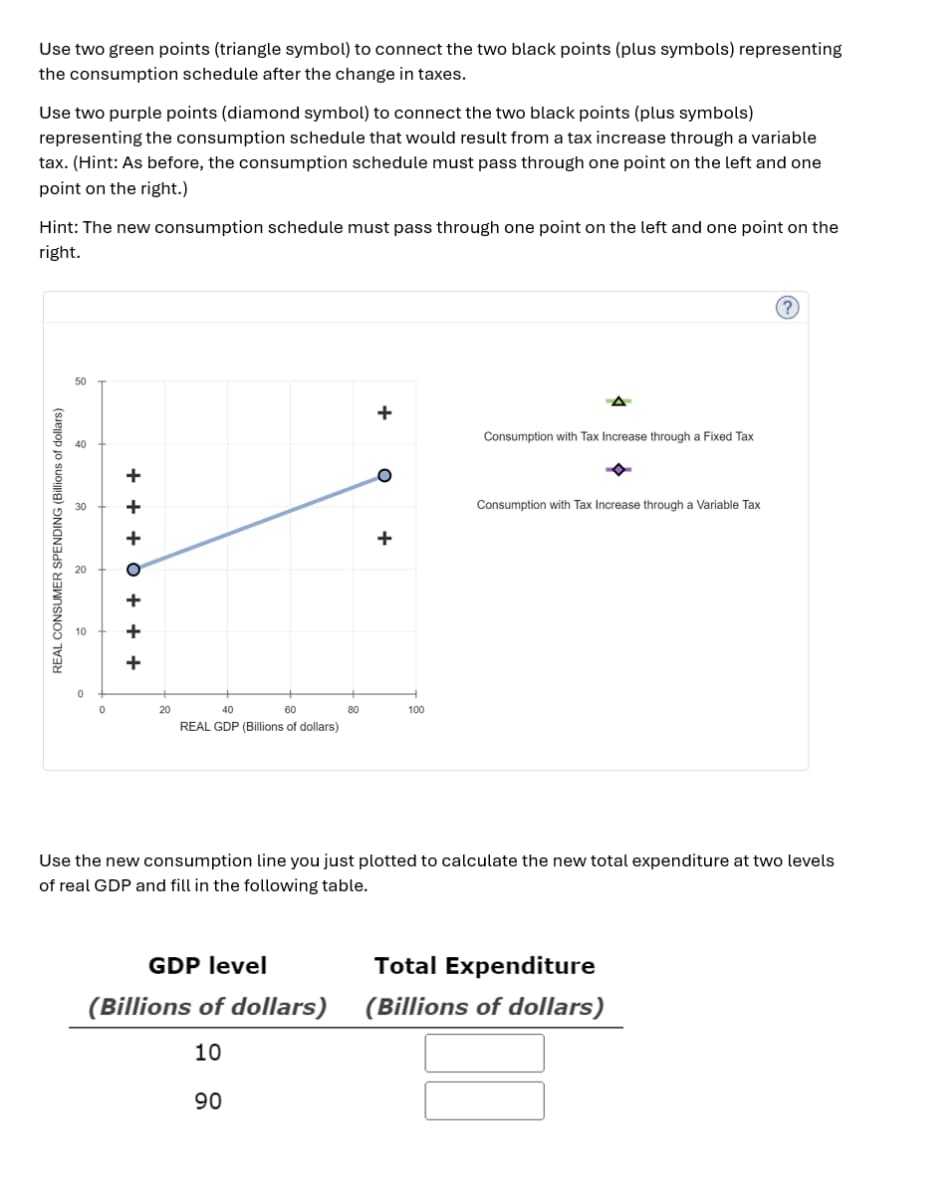
Transcribed Image Text:Use two green points (triangle symbol) to connect the two black points (plus symbols) representing
the consumption schedule after the change in taxes.
Use two purple points (diamond symbol) to connect the two black points (plus symbols)
representing the consumption schedule that would result from a tax increase through a variable
tax. (Hint: As before, the consumption schedule must pass through one point on the left and one
point on the right.)
Hint: The new consumption schedule must pass through one point on the left and one point on the
right.
50
REAL CONSUMER SPENDING (Billions of dollars)
10
8
+
Consumption with Tax Increase through a Fixed Tax
+
Consumption with Tax Increase through a Variable Tax
+
+
+
+
20
40
60
REAL GDP (Billions of dollars)
80
100
(?)
Use the new consumption line you just plotted to calculate the new total expenditure at two levels
of real GDP and fill in the following table.
GDP level
(Billions of dollars)
10
90
Total Expenditure
(Billions of dollars)
Expert Solution
This question has been solved!
Explore an expertly crafted, step-by-step solution for a thorough understanding of key concepts.

This is a popular solution!

Trending now
This is a popular solution!

Step by step
Solved in 2 steps

Recommended textbooks for you


Macroeconomics: Principles and Policy (MindTap Co…
Economics
ISBN:
9781305280601
Author:
William J. Baumol, Alan S. Blinder
Publisher:
Cengage Learning


Exploring Economics
Economics
ISBN:
9781544336329
Author:
Robert L. Sexton
Publisher:
SAGE Publications, Inc