


Electron Transport Chain
The electron transport chain, also known as the electron transport system, is a group of proteins that transfer electrons through a membrane within mitochondria to create a gradient of protons that drives adenosine triphosphate (ATP)synthesis. The cell uses ATP as an energy source for metabolic processes and cellular functions. ETC involves series of reactions that convert redox energy from NADH (nicotinamide adenine dinucleotide (NAD) + hydrogen (H)) and FADH2(flavin adenine dinucleotide (FAD)) oxidation into proton-motive force(PMF), which is then used to synthesize ATP through conformational changes in the ATP synthase complex, a process known as oxidative phosphorylation.
Metabolism
Picture a campfire. It keeps the body warm on a cold night and provides light. To ensure that the fire keeps burning, fuel needs to be added(pieces of wood in this case). When a small piece is added, the fire burns bright for a bit and then dies down unless more wood is added. But, if too many pieces are placed at a time, the fire escalates and burns for a longer time, without actually burning away all the pieces that have been added. Many of them, especially the larger chunks or damp pieces, remain unburnt.
Cellular Respiration
Cellular respiration is the cellular process involved in the generation of adenosine triphosphate (ATP) molecules from the organic nutritional source obtained from the diet. It is a universal process observed in all types of life forms. The glucose (chemical formula C6H12O6) molecules are the preferred raw material for cell respiration as it possesses a simple structure and is highly efficient in nature.
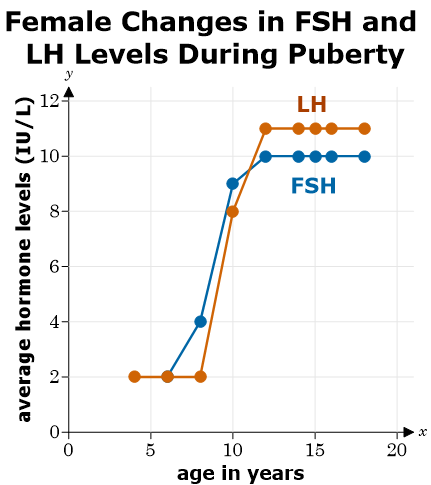
Use the graphs to answer the question.
Which answer describes a logical reason why LH and FSH were chosen for this study?
-
A.
These hormones regulate gametogenesis and sex hormone production, so they play a pivotal role in puberty.
-
B.
These hormones are only present in individuals undergoing puberty, so they provide a good indication of puberty.
-
C.
These hormones directly cause puberty related changes.
-
D.
These hormones are the only ones that fluctuate with puberty while other hormones are unchanged.
Use the graph to answer the question.
The graph indicates increases in both FSH and LH for males and females. However, male and female signs of puberty differ. Which of the following explains why?
-
A.
Hormone levels increase for both of them, but LH levels increase more for males and less for females.
-
B.
FSH and LH trigger higher testosterone production in males and higher estrogen production in females.
-
C.
FSH and LH promote a positive feedback loop in females and a negative feedback look in males.
-
D.
Reproductive systems of males and females have a different origin in development, and the cells within them therefore respond differently to the hormones.
Use the graphto answer the question.
If this data collection process was conducted on a daily basis, how would the data look different?
-
A.
The male data would show daily drops in LH and FSH associated with food consumption.
-
B.
The female data would show compensation for LH drops with increases in FSH and vice versa.
-
C.
The male data would show higher levels of testosterone corresponding to lower levels of LH and FSH.
-
D.
The female data would show monthly fluctuations of LH and FSH.
-
-

Step by step
Solved in 4 steps


