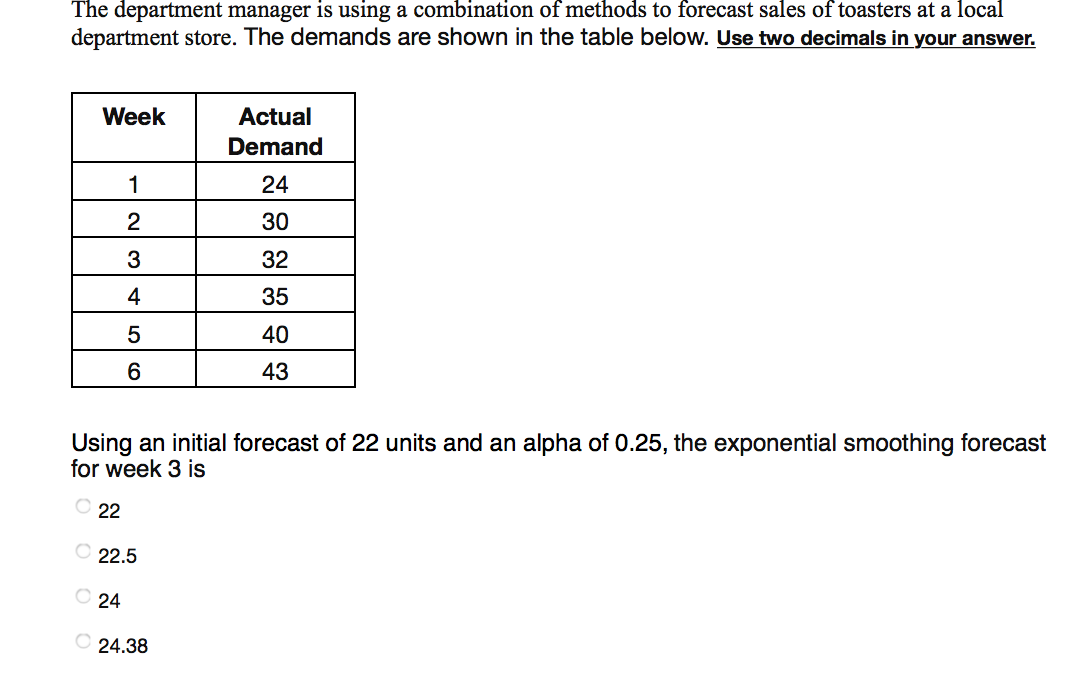
Using an initial forecast of 22 units and an alpha of 0.25, the exponential smoothing forecast for week 3 is 22 O 22.5 24 24.38


Q: Using simple exponential smoothing and the following time series data, respond to each of the items.…
A: Given data 1 106 2 134 3 145 4 139 5 148 6 152 7 103 8 128 9 118 10 117
Q: (d) Use each of the three fitted trend equations to make numerical forecasts for the next three…
A: Introduction: The independent variable is the year, denoted in the question as t, and denoted in the…
Q: Determine which of the following data sets are linear and which are exponential. For the linear…
A: Part (a) Given data set is
Q: Assuming that real GDP per person is a good measure of living standards, between 2016 and 2017,…
A:
Q: Consider the following data. Period Rate of Return (%) 1 - 6.0 2 - 8.2 3 - 4.2 4 2.2 5 5.6 What is…
A: Given Period Rate of return 1 -6.0 2.…
Q: Complete the table shown to the right for the population growth model for a certain country.…
A:
Q: Based on the scatterplot and computer output, a reasonable estimate for the stock price for week 95…
A: Given : Constant = 2.0583 Coefficient of weeks = 0.0022
Q: Based on the following data, a forecaster used simple exponential smoothing and determined the…
A: Answer:- Option d. is the correct answer. Given, n=5
Q: Do the following table of values represent a exponential fuction? If it does. What is the growth…
A:
Q: a)Outline the diffences between simple, double and triple exponential smoothing? b) Consider the…
A: Exponential smoothing of time series data assigns exponentially decreasing weights for newest to…
Q: 1. Fit the following data with (a) an exponential model and (b) a saturation-growth-rate eqat x y 1…
A: Note: According to Bartleby we have to solve the first question only please upload the question…
Q: The lifetime of a printer costing $200 is exponentially distributed with mean 2 years. The…
A: Given : The lifetime of a printer costing $200 is exponentially distributed with mean 2…
Q: Ten weeks of data on the commodity Futures Index are 7.35, 7.4, 7.55, 7.56, 7.6, 7.52, 7.52, 7.7,…
A: Formula Used: Ft+1=Ft+α(At-Ft)Ft+1=αAt+(1-α)Ft We use second formula to calculate exponential…
Q: Tough Face, a manufacturer of rock-climbing gear, has been enjoying steady growth of its very…
A: We haveα = 0.75β=0.85Initialisation:A1 =250T1=150 Formula to be…
Q: The forecast for week 13 is
A: Given, Period 1 2 3 4 5 6 7 8 9 10 11 12 Sales 617 617 648…
Q: Given the following data, compute the MAD for the forecasts. Round your answer to two decimal…
A: Formula for MAD: MAD=∑Actual demand-Forecast valuen
Q: Fit the exponential trend for the following data and find the trend values Year : 1958 1968 1978…
A:
Q: The table below shows outstanding consumer credit (in billions of dollars) at the beginning of…
A: Let the exponential model be yi=abtiTaking logarithm on both sides, we get…
Q: The population in Barangay Dela Paz in Pasig for the year 2015 is approximately 15,000. If the…
A: (5) Given that , Population in 2015 is P=15000 Growth rate R=1.2% Time t=2020-2015=5 years Find…
Q: Compare the first differences and the percent changeof the outputs to determine if the data in the…
A: Compare the first differences and the percent change of the outputs to determine if the data in the…
Q: Following table presents the quarterly market share of Tasty Food Company; Quarter Firm’s Actual…
A: Here given that w= 0.3 So (1-w)= 0.7 Exponential smoothing predicted values are given by, Ft=…
Q: 4) Use the situation to answer the question. Iodine-131 has a half-life of 8 days. How much of the…
A:
Q: The following table shows a 2009 forecast of online marketing expenditures. 2008 2009 2010 2011 2012…
A: As per the question we are given a data table relating the year(x) and total marketing expenditure…
Q: The population of the United States has grown at different rates over ten-year increments as shown…
A: According to the given information, Maximum supportable population of US = 600 million
Q: For the data given, use the arithmetic average of the first six months of data as a baseline to…
A: a.
Q: Assuming that population growth is approximately exponential, which of the following two sets of…
A: Given that the population growth is approximately exponential . This implies the ratio of population…
Q: Week Amount EstimateWeek_Amount Estimate_ 10 10.000 6 14 11.90390 11 10.000 24 12.11351 21 10.100 18…
A: Introduction: The Exponential Smoothing Parameter in this case is, α = 0.1. The estimated or…
Q: Determine which of the following data sets are linear and which are exponential. For the linear…
A:
Q: b. Compute a five-quarter simple moving average forecast for quarters 6 through 13 and compute the…
A:
Q: Given an actual demand this period of 103, a forecast value for this period of 99, and an alpha of…
A:
Q: Complete the table shown to the right for the population growth model for a certain country. The…
A:
Q: pax world balance: x =9.58%; s=14.07% vanguard balance index: x=9.09%; s=12.47% compute a 75%…
A:
Q: The population of the United States has grown at different rates over ten-year increments as shown…
A: In 1930 the population was 123.1 million and in 1940 the population was 131.1 million.So, the…
Q: The life expectancies of black males in the United States at various ages for 2006 are as shown…
A: Hey, since there are multiple questions posted, we will answer first question. If you want any…
Q: Consider the following time series data. Month 1 2 3 4 5 6 7 Value 22 11 18 10 17 21 13 (a) Compute…
A: The following solution is given below:
Q: Listed beow is the sales of cars (in millons) Year Price 2002 13.81 2003 10.80 2004 13.23 2005 13.72…
A:
Q: Estimate the population at 2000 using the following data by Declining growth and Curve fitting…
A: Given the following data, Year Population 1970 10000 1980 15000 1990 18000 2000 k We…
Q: A convenience store recently started to carry a new brand of soft drink. Management is interested in…
A: Given Data : Period / week Sales 1 572 2 637 3 648 4 740 5 670 6 633 7 752 8 690…
Q: After plotting demand for four periods, an emergency room manager has concluded that a…
A: Please find the explanation below. Thank you
Q: Suppose that the time to failure (in hours) of fans in a personal computer can be modeled by an…
A: 1) Solution The proportion of fans will last at most 10000 hours is 0.9502
Q: The life expectancies of black males in the United States at various ages for 2006 are as shown…
A: a) At birth age=0 So coordinate are (0,69.7) and (60,18.2). We find the average rate of change…
Q: 5. Use regression to determine an exponential model for the following data. Round all parameters to…
A: Regression is used for prediction purpose. equation of line of regression is y= a+bx where y is…
Q: Which of the following display exponential growth? Select all that apply. OP= 750(0.995)*…
A:
Q: The following data represent a portion of quarterly net sales (in $ millions) of Lowe's Companies,…
A: Solution: From the given information,
Q: Given an exponential distribution with the notation: X ~ Exp(0.1). Find the following: (the decay…
A:
Q: The population of the United States has grown at different rates over ten-year increments as shown…
A: Given data Year Population of U.S. 1930 123.1 million 1940 132.1 million 1950 152.3…
Q: The useful life of an electrical component is exponentially distributed with a mean of 1,000 hours.…
A: Let X denotes the useful life of an electrical component and it follows an exponential distribution…
Q: Complete the table shown to the right for the population growth model for a certain country. 2006…
A: Population decrease in the proceedings years therefore growth is negative

Step by step
Solved in 2 steps


- What does the y -intercept on the graph of a logistic equation correspond to for a population modeled by that equation?Number of Certified Organic Farmsin the United States, 2001–2008 Year Farms 2001 5,441 2002 5,806 2003 6,546 2004 6,528 2005 6,944 2006 7,854 2007 9,430 2008 10,728 Fit three trends: linear yt= xt+quadratic yt= xt^2+ xt+ exponential yt= e x Use each of the three fitted trend equations to make numerical forecasts for the next three years. t Linear Quadratic Exponential 9 10 11For the Hawkins Company, the monthly percentages of all shipments received on time over the past 12 months are 80, 82, 84, 83, 83, 84, 85, 84, 82, 83, 84, and 83. a. Compute for a 3 month moving average forecast. b. Compute for the exponential smoothing forecast for a=0.2. c. Which provides the better forecast using MSE as the measure of model accuracy? d. What is the forecast for next month?
- Storrs Cycles has just started selling the new Cyclonemountain bike, with monthly sales as shown in the table. First,co-owner Bob Day wants to forecast by exponential smoothingby initially setting February’s forecast equal to January’s saleswith a = .1. Co-owner Sherry Snyder wants to use a three-periodmoving average. a) Is there a strong linear trend in sales over time?b) Fill in the table with what Bob and Sherry each forecast forMay and the earlier months, as relevant.c) Assume that May’s actual sales figure turns out to be 405.Complete the table’s columns and then calculate the meanabsolute deviation for both Bob’s and Sherry’s methods.d) Based on these calculations, which method seems moreaccurate?A pizza chain has had sales for take-out food over the last four evenings—Monday, Tuesday, Wednesday, and Thursday—of 29, 25, 35, and 30 pizzas, respectively.What would be their forecast for Friday using an exponential smoothing forecastingapproach? Use α = 0.2 and a forecast for Monday of 28.With the gasoline time series data from table 17.1, show the exponential smoothing forecasts using a = .1.a. applying the MSe measure of forecast accuracy, would you prefer a smoothing constant of a = .1 or a = .2 for the gasoline sales time series?b. are the results the same if you apply Mae as the measure of accuracy?c. What are the results if Mape is used?
- The figures below show the weekly demand at an electrical repair workshop for a certain type of connector over a 10-week period. a) Use exponential smoothing with α values of 0.2, 0.3, 0.4 to smooth the data and obtain a forecast for week 11. (b) Using the MSE criterion, which value gives the best results?After constant complaints about the long wait from his customers, Ryan - the owner of shop - hasdecided to hire a second mechanic to handle installations. Customers, who arrive at a rate ofabout 3 per hour (Poisson), will wait in a single line until one of the two mechanics is free. Eachmechanic can serve about four customers per hour (Exponential).Do you think the improvement on customer experience will be significant? Computethe key waiting line characteristics BEFORE and AFTER the second mechanic is hired tosupport your answer.With the gasoline time series data from the given table, show the exponential smoothing forecasts using = 0.1. Week Sales (1000s of gallons) 1 17 2 21 3 19 4 23 5 18 6 16 7 20 8 18 9 22 10 20 11 15 12 22 Applying the MSE measure of forecast accuracy, would you prefer a smoothing constant of = 0.1 or = 0.2 for the gasoline sales time series? Do not round your interim computations and round your final answers to two decimal places. = 0.1 = 0.2 MSE fill in the blank 1 fill in the blank 2 Prefer: 01. or 0.2 2. Are the results the same if you apply MAE as the measure of accuracy? Do not round your interim computations and round your final answers to two decimal places. = 0.1 = 0.2 MAE fill in the blank 4 fill in the blank 5 Prefer: 0.1 or 0.2 3. What are the results if MAPE is used? Do not round your interim computations and round your final answers to two decimal places. = 0.1 = 0.2 MAPE fill in…
- Here are the actual tabulated demands for an item for a nine-month period (January through September). Your supervisor wants to test two forecasting methods to see which method was better over this period. MONTH ACTUAL January 110 February 130 March 150 April 170 May 160 June 180 July 140 August 130 September 140 a. Forecast April through September using a three-month moving average. Note: Round your answers to 1 decimal place. b. Use simple exponential smoothing with an alpha of 0.3 to estimate April through September, using the average of January through March as the initial forecast for April. Note: Do not round intermediate calculations. Round your answers to 2 decimal places. c-1. Calculate MAD for each method. Note: Round your answers to 1 decimal place. c-2. Use MAD to decide which method produced the better forecast over the six-month period. multiple choice Exponential smoothing. Three-month moving average.The Bayside Fountain Hotel is adjacent to County Coliseum, a 24,000-seat arena that is home tothe city’s professional basketball and ice hockey teams and that hosts a variety of concerts, tradeshows, and conventions throughout the year. The hotel has experienced the following occupancyrates for the past 9 years, since the coliseum opened:Year Occupancy Rate (%)1 832 783 754 815 866 857 898 909 86 Compute an exponential smoothing forecast with a = .20, an adjusted exponential smoothingforecast with a = .20 and B=30 and a linear trend line forecast. Compare the three forecasts,using MAD and average error ( ), and indicate which seems to be most accurate.You have the following table: Index of Housing Starts in Wonderland: 2009 to 2020 (with 2008 = 100) Y ear 2009 2010 2011 2012 2013 2014 2015 2016 2017 2018 2019 2020 Index 116 122 121 121 111 97 113 125 146 142 156 162 (A) Forecast the index of housing starts in Wonderland in 2021 by exponential smoothing with the following weights: w = 0.3 and w = 0.7 (B) Which of these forecasts gives a better forecast for 2021? Explain why!


