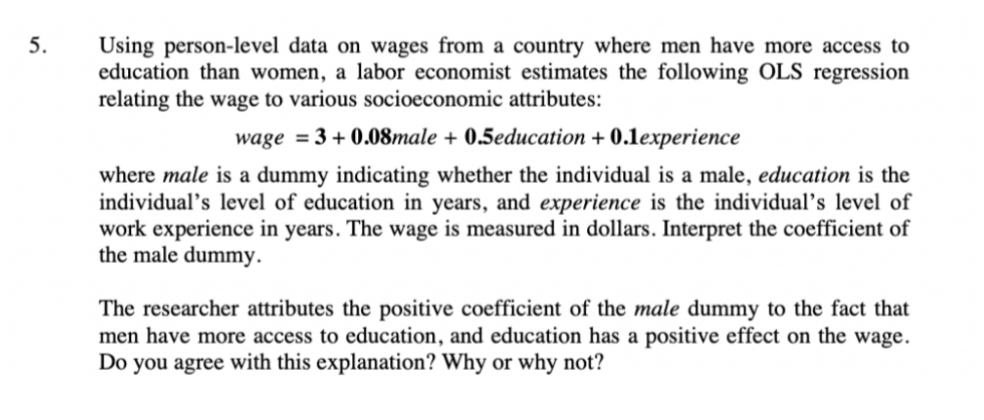
Using person-level data on wages from a country where men have more access to education than women, a labor economist estimates the following OLS regression relating the wage to various socioeconomic attributes: wage = 3 + 0.08male + 0.5education + 0.1experience where male is a dummy indicating whether the individual is a male, education is the individual's level of education in years, and experience is the individual's level of work experience in years. The wage is measured in dollars. Interpret the coefficient of the male dummy. The researcher attributes the positive coefficient of the male dummy to the fact that men have more access to education, and education has a positive effect on the wage. Do you agree with this explanation? Why or why not?
Q: A simple random sample of 120 vet clinics in the Midwest reveals that the vast majority of clinics…
A: Given that; Sample size (n) = 120 X = 88 At 90% confidence interval .
Q: The average starting salary of students who graduated from colleges of Business in 2009 was $48,800.…
A:
Q: Choose the letter of the correct answer. 1. In one tailed test, in which critical values below will…
A:
Q: Using Excel, conduct a t-test (at the alpha = 0.01 significance level) on whether the mean of X1 is…
A: Given: The data is as below X1 X2 98.5 101.52 102.03 100.29 100.23 104 101.32 97.74…
Q: experiment an analyst has observed that equals-212.35, SSx equals 237.16 and SS B49. The sample…
A: Compute the y value if x = 200 SSXY ∑x-x¯y-y¯ -212.35 SSX ∑x-x¯2 237.16 SSY ∑y-y¯2 858.49…
Q: he other hand, if it leaves late this time then there is a 70% chance that it woul Suppose that…
A: *Answer: Let A and B be two events with P(A) > 0. Then the conditional probability of B given A,…
Q: A survey asks 2000 workers, "Has the economy forced you to reduce the amount of vacation you plan…
A: We have given that p = 45% = 0.45 n = 10
Q: The number of industrial injuries per working week in a particular factory is known to follow a…
A: Given that Mean =λ=0.5 X~poisson (λ) Where λ ia a parameter.
Q: Suppose X is binomially distributed with E[X]=120 and Var(X)=48. (Choose The correct answer) Then…
A:
Q: 4. Suppose on average, Mymensingh registers 20 fatalities per week from the novel coronavirus. a.…
A:
Q: A research company claims that 55% of American watch TV. You test this claim by randomly sampling…
A:
Q: 2. Develop a linear trend line for the following data. Plot the line and the data on a graph and…
A:
Q: B. PROBLEM SOLVING: Determine the z-value for each of the following x values for a normal…
A: From the provided information, Mean (µ) = 17 Standard deviation (σ) = 4
Q: O A. Ho µ= 10 H, p> 10 O B. H, p+10 O C. H, µ 10 YE. H u=10 OF. H, p=10 H, p VB. t 2.26 t< Find the…
A: We have given that Population mean = 10 The sample data set of size 10.
Q: B F rch company tests the effectiveness of three new flavorings for a new sauce using a sar vor 1,…
A: Given,
Q: nsider the summary of a survey conducted by a mai tection policies among residents of two regions of…
A: GIven, Observed frequency (fo) Table" By applying the chi-square test of independence, The null and…
Q: 2 An experiment involves the tossing of a pair of dice, 1 green and 1 red, and recording the numbers…
A: Given: Let us consider that tossing a green and a red die and recording the numbers that appear on…
Q: You wish to test the following claim (Ha) at a significance level of α=0.001α=0.001.…
A:
Q: According to the steps of hypothesis testing, if you are using an independent samples t test, which…
A: For independent sample t -test statistics. First know about population mean μ and sample mean,…
Q: Question 24 Prove that if SRS, = {X1, X2, X3,...,X} € N(u, 0), then X = N (, ) Edit View Insert…
A: Given that; Xi follow the normal distribution with mean μ and variance ?2 . By using sampling to…
Q: assume that a contingency table analysis with 6 rows and 3 columns the calculated value for X2 is…
A: Given that Row=6 , Columns=3 Chi-square=χ2=25.82
Q: A group of people were asked if some people see the future in their dreams. 110 responded "Yes", and…
A:
Q: which of the following sample data: sample size= 100 sample mean= 340z/hr sample variance= 90z/…
A:
Q: A popular resort hotel has 200 rooms and is usually fully booked. About 6% of the time a reservation…
A: Given that
Q: A marketing research firm presented an advertisement for a product to random samples of potential…
A: Solution-: We find the test of problem, degree of freedom, test statistic and p-value by using…
Q: Find the five-number summary, and (b) draw a box-and-whisker plot of the data. 3 8 8 5…
A: Five number summary is: Min, Q1, Q2, Q3, Max Where Q1 is first quartile, Q2 is median and Q3 is…
Q: Suppose the 95% confidence interval for a population mean is (20.5, 35.5). What is the margin of…
A:
Q: 2. A researcher divided the subjects into 4 groups according to year level and then selected members…
A: The sampling method used in this process is stratified sampling
Q: Which of the following statements is true of statistical significance? The larger the sample, the…
A: We have given that the statement about to the significance level. Here, need to find out the correct…
Q: XYZ Cable corporation employs 2,500 people. If a random sample of 165 is taken from the entire…
A: given that the XYZ corporation employs 2500 people. i.e. population size = N = 2500 and the random…
Q: The probability distribution function of a discrete random variable X is x2 55 ,x = 1,2,3,4,5 0,…
A: Find Var(3X+2)=? 5E(2X-1)=? E(2X+1)2=?
Q: As temperatures get lower, air conditioning costs decrease. O As alcohol drinking increases, so does…
A: Correlation: Correlation may be defined as the linear relationship between the two variables.
Q: CALLENE 721 Confidence intervals for population proportions. ACTIVITY Critical values for quick…
A: Introduction: Population Proportion: The population proportion can be denoted by P. The population…
Q: Given the following two models, log C = ß1 + BzlogGD; + û¡ and logG = B1 + BzlogGl; + û use…
A:
Q: a. What is the probability that the customer is at least 30 but no older than 49? b. What is the…
A: here use given frequency distribution here in given table total 487 customer involve in survey here…
Q: In an experiment an analyst has observed that SSxy equals 212.35, SSx equals 237.16 and SSy =…
A: Given values: SSXY=-212.35 SSX=237.16 SSY=858.49
Q: Question 12 13% of internet sites referenced in scientific journals are lost within 2 years of…
A: Given that n=7 , p=13%=0.13 , q=1-p=1-0.13=0.87 X~Binomial(n=7,q=0.87) X=Number good internet site…
Q: A sample of 3000 persons were surveyed for their weight in pounds, the mean weight is 135 Ibs with a…
A:
Q: Observed Tensile Strenght Weight Percentage lb/ in TOTALS AVERAGES Cotton 1 4 15 8 8 8. 34 58 11.6…
A:
Q: Identify the sample space of the probability experiment and determine the number of outcomes in the…
A: We have given that, Number from multiple of 4 between 20 and 40 (inclusive). We will identify the…
Q: A simple random sample of 100 bags of tortilla chips produced by Company X is selected every hour…
A: Given that X=18 , n=100
Q: ute the mean and standard deviation of the provided sample data on cost of living adjustments. Then…
A: Given: The data given is as follows Comparative Salary (in $) Housing (in %) 105241 304…
Q: We sometimes hear that getting married is good for your career. Assume the table presents data from…
A: Given information: Income Single(Never married) Married Divorced Widowed Total No income 5403…
Q: Jump lo level 1 An online math tutor service would like to claim that the average time spent taking…
A:
Q: Find the 3rd quartile of the given data: 19, 12, 16, 0, 14, 9, 6, 1, 12, 13, 10, 19, 7, 5, 8 *…
A: As per company guidelines I solved only First questions.thank you
Q: Given a recent outbreak of illness caused by E. coli bacteria, the mayor in a large city is…
A: There are two categorical samples which are Inspector and Restaurant. We have to construct ANOVA…
Q: The test statistic for testing HO: mu = 100 against Ha: mu != 100 was t = 3.3, with p-value of…
A:
Q: A researcher claims that the average wind speed in a certain city is 8 miles per hour. A sample of…
A:
Q: (4xy,0 < x < 1,0 < y < 1 0, Let continuous f (x, y) : otherwise a. Calculate Pr(X<÷,Y < 1). b.…
A:
Q: A poll is given, showing 50% are in favor of a new building project. If 9 people are chosen at…
A:
3
Step by step
Solved in 2 steps
- A researcher notes that, in a certain region, a disproportionate number of software millionaires were born around the year 1955. Is this a coincidence, or does birth year matter when gauging whether a software founder will besuccessful? The researcher investigated this question by analyzing the data shown in the accompanying table. Complete parts a through c below. a. Find the coefficient of determination for the simple linear regression model relating number (y) of software millionaire birthdays in a decade to total number (x) of births in the region. Interpret the result. The coefficient of determination is 1.___? (Round to three decimal places as needed.) This value indicates that 2.____ of the sample variation in the number of software millionaire birthdays is explained by the linear relationship with the total number of births in the region. (Round to one decimal place as needed.) b. Find the coefficient of determination for the simple linear regression model…Suppose that a kitchen cabinet warehouse company would like to be able to predict the area of a customer’s kitchen using the number of cabinets and the kitchen ceiling height. To do so data is collected on the following variables from a random sample of customers: Area – area of the kitchen in square feet Height – ceiling height in the kitchen (from floor to ceiling) in inches Cabinets – number of cabinets in the kitchen Suppose that a multiple linear regression model was fit to the data and that the following output resulted: Coefficients: (Intercept)HeightCabinets Estimate-57.98771.2760.3393 Std. Error8.63820.26430.1302 t value -6.7134.8282.607 Pr(>|t|)2.75e-074.44e-050.0145 What is the predicted area of a kitchen with a height of 96 inches and 10 cabinets? Report your answer to 1 decimal place. square feetSuppose that a kitchen cabinet warehouse company would like to be able to predict the area of a customer’s kitchen using the number of cabinets and the kitchen ceiling height. To do so data is collected on the following variables from a random sample of customers: Area – area of the kitchen in square feet Height – ceiling height in the kitchen (from floor to ceiling) in inches Cabinets – number of cabinets in the kitchen Suppose that a multiple linear regression model was fit to the data and that the following output resulted: Coefficients: (Intercept)HeightCabinets Estimate-57.98771.2760.3393 Std. Error8.63820.26430.1302 t value -6.7134.8282.607 Pr(>|t|)2.75e-074.44e-050.0145 10 Question 10 This is not a form; we suggest that you use the browse mode and read all parts of the question carefully. Which of the following is the correct interpretation of the coefficient for Cabinets? For a kitchen with a given ceiling height, the average number of cabinets…
- Suppose that a kitchen cabinet warehouse company would like to be able to predict the area of a customer’s kitchen using the number of cabinets and the kitchen ceiling height. To do so data is collected on the following variables from a random sample of customers: Area – area of the kitchen in square feet Height – ceiling height in the kitchen (from floor to ceiling) in inches Cabinets – number of cabinets in the kitchen Suppose that a multiple linear regression model was fit to the data and that the following output resulted: Coefficients: (Intercept)HeightCabinets Estimate-57.98771.2760.3393 Std. Error8.63820.26430.1302 t value -6.7134.8282.607 Pr(>|t|)2.75e-074.44e-050.0145 Why is the interpretation of the constant term (i.e. "intercept") not meaningful for this example? The predicted area will be negative when the number of cabinets is zero and the height of the kitchen is also zero. But we cannot have a negative area, nor a kitchen ceiling height of 0 inches.…A sample of n = 120 scores were presented using the Tenacity (authority) scores to the following predictors: age gender, SES, tone of voice, and clothing. Using a two-tailed test at the 0.05 level of significance, a multiple regression analysis was computed: 1. tenacity and age (pvalue = 0.043); 2. tenacity and gender (pvalue = 0.102); 3. tenacity and SES (pvalue = 0.40); 4. tenacity and voice (pvalue = 0.001); 5. tenacity and clothing (value = 0.017); SOrs Using the pvalue, provide your DECISION, whether:Accept Ho or Reject Ho, Accept HaThe average asking rent for 10 markets, and the corresponding monthly mortgage on the median priced home (including taxes and insurance) for 10 cities are given in Rent ($) Mortgage ($) City 1 840 539 City 2 1062 1002 City 3 823 626 City 4 779 711 City 5 796 655 City 6 1071 977 City 7 953 776 City 8 851 695 City 9 762 651 City 10 723 654 What is the quadratic regression model to predict the monthly mortgage on the median priced home, using average asking rent? Fill in the coefficient for the Quadratic independent variable (keep 3 decimal points).
- The Update to the Task Force Report on Blood Pressure Control in Children [12] reported the observed 90th per-centile of SBP in single years of age from age 1 to 17 based on prior studies. The data for boys of average height are given in Table 11.18. Suppose we seek a more efficient way to display the data and choose linear regression to accomplish this task. age sbp 1 99 2 102 3 105 4 107 5 108 6 110 7 111 8 112 9 114 10 115 11 117 12 120 13 122 14 125 15 127 16 130 17 132 Do you think the linear regression provides a good fit to the data? Why or why not? Use residual analysis to justify your answer. Am I supposed to run a residual plot and QQ-plot for this question?Which of the following is not an example of systematic error in an observational study? A cross-sectional study recruits participants that are willing to sign up outside of a major university and meet the inclusion and exclusion criteria to take part in the survey relating unsafe sex habits to STIs. A researcher is interested in the relationship between coffee drinking and lung cancer, and after careful multivariate linear regression modeling determines that a significant percentage of the relationship is due to another variable, cigarette smoking. An observational study recruits participants for a study looking at Alzheimer’s disease due to exposure to industrial hazards by asking participants to recall their exposure over the past 10 years. data-entry specialist responsible for adding in fasting glucose levels to a database accidentally skipped an observation during the input phase of data cleaning.A sample of n = 120 scores were presented using the Tenacity (authority) scores to the following predictors: age gender, SES, tone of voice, and clothing. Using a two-tailed test at the 0.05 level of significance, a multiple regression analysis was computed: 1. tenacity and age (pvalue = 0.043); 2. tenacity and gender (pvalue = 0.102); 3. tenacity and SES (pvalue = 0.40); Using the pvalue, provide your DECISION, whether: Accept Ho or Reject Ho, Accept Ha
- A sample of n= 120 scores were presented using the tendency(authority) scores to the following predictors age gender, SES, tone of voice, and clothing. Using a two-tailed at the 0.05 level of significance, a multiple regression analysis was computed Using the pvalue, provide your DECISION, whether ACCEPT Ho or REJECT HO,ACCEPT Ha 1.) Tenacity and SES(pvalue=0.40) 2.) Tenancity and voice(pvalue=0.001) 3.) Tenancity and clothing(pvalue=0.017)A sample of n = 120 scores were presented using the Tenacity (authority) scores to the following predictors: age gender, SES, tone of voice, and clothing. Using a two-tailed test at the 0.05 level of significance, a multiple regression analysis was computed: 1. tenacity and voice (pvalue = 0.001); 2. tenacity and clothing (pvalue = 0.017); Using the pvalue, provide your DECISION, whether: Accept Ho or Reject Ho, Accept HaIf all the points in a scatter diagram lie on the least squares regression line, what must be the coefficient of correlation equal to