experiment an analyst has observed that equals-212.35, SSx equals 237.16 and SS B49. The sample average for x was 193.1 he sample average for y was 15.2.Assume linear regression model is appropriate.
experiment an analyst has observed that equals-212.35, SSx equals 237.16 and SS B49. The sample average for x was 193.1 he sample average for y was 15.2.Assume linear regression model is appropriate.

Chapter4: Linear Functions
Section4.3: Fitting Linear Models To Data
Problem 34SE: For the following exercises, consider this scenario: The profit of a company decreased steadily...

Related questions
Question
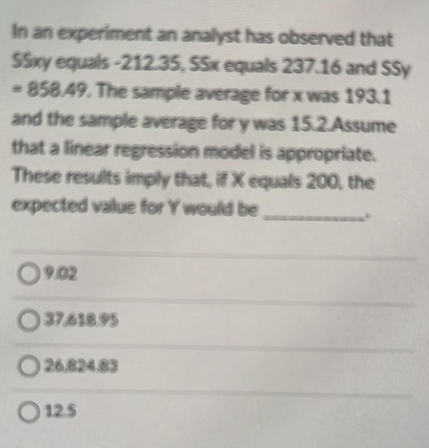
Transcribed Image Text:In an experiment an analyst has observed that
SSxy equals-212.35, SSx equals 237.16 and SSy
-858.49. The sample average for x was 193.1
and the sample average for y was 15.2.Assume
that a linear regression model is appropriate.
These results imply that, if X equals 200, the
expected value for Y would be
09.02
O 37,618.95
O 26,824.83
O 12.5
Expert Solution
This question has been solved!
Explore an expertly crafted, step-by-step solution for a thorough understanding of key concepts.

Step by step
Solved in 2 steps

Recommended textbooks for you

Functions and Change: A Modeling Approach to Coll…
Algebra
ISBN:
9781337111348
Author:
Bruce Crauder, Benny Evans, Alan Noell
Publisher:
Cengage Learning

Algebra & Trigonometry with Analytic Geometry
Algebra
ISBN:
9781133382119
Author:
Swokowski
Publisher:
Cengage
Functions and Change: A Modeling Approach to Coll…
Algebra
ISBN:
9781337111348
Author:
Bruce Crauder, Benny Evans, Alan Noell
Publisher:
Cengage Learning
Algebra & Trigonometry with Analytic Geometry
Algebra
ISBN:
9781133382119
Author:
Swokowski
Publisher:
Cengage

College Algebra
Algebra
ISBN:
9781305115545
Author:
James Stewart, Lothar Redlin, Saleem Watson
Publisher:
Cengage Learning

Algebra and Trigonometry (MindTap Course List)
Algebra
ISBN:
9781305071742
Author:
James Stewart, Lothar Redlin, Saleem Watson
Publisher:
Cengage Learning