Using simple exponential smoothing and the following time series data, respond to each of the items. Period D
Using simple exponential smoothing and the following time series data, respond to each of the items. Period D

Linear Algebra: A Modern Introduction
4th Edition
ISBN:9781285463247
Author:David Poole
Publisher:David Poole
Chapter7: Distance And Approximation
Section7.3: Least Squares Approximation
Problem 31EQ

Related questions
Question
Using simple exponential smoothing and the following time series data, respond to each of the items.
| Period | Demand |
| 1 | 72 |
| 2 | 60 |
| 3 | 27 |
| 4 | 52 |
| 5 | 26 |
| 6 | 46 |
| 7 | 52 |
| 8 | 28 |
| 9 | 53 |
| 10 | 50 |
| 11 | 57 |
| 12 | 87 |
| 13 | 22 |
| 14 | 56 |
Please show work.
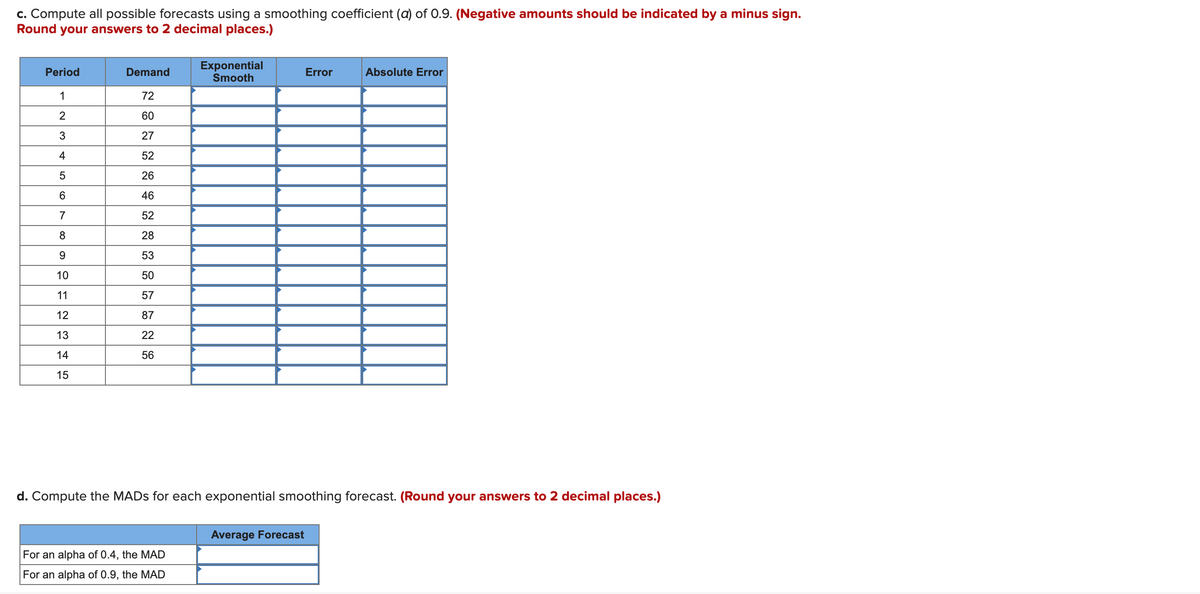
Transcribed Image Text:c. Compute all possible forecasts using a smoothing coefficient (a) of 0.9. (Negative amounts should be indicated by a minus sign.
Round your answers to 2 decimal places.)
Exponential
Smooth
Period
Demand
Error
Absolute Error
1
72
60
3
27
4
52
26
6
46
7
52
8
28
9.
53
10
50
11
57
12
87
13
22
14
56
15
d. Compute the MADS for each exponential smoothing forecast. (Round your answers to 2 decimal places.)
Average Forecast
For an alpha of 0.4, the MAD
For an alpha of 0.9, the MAD
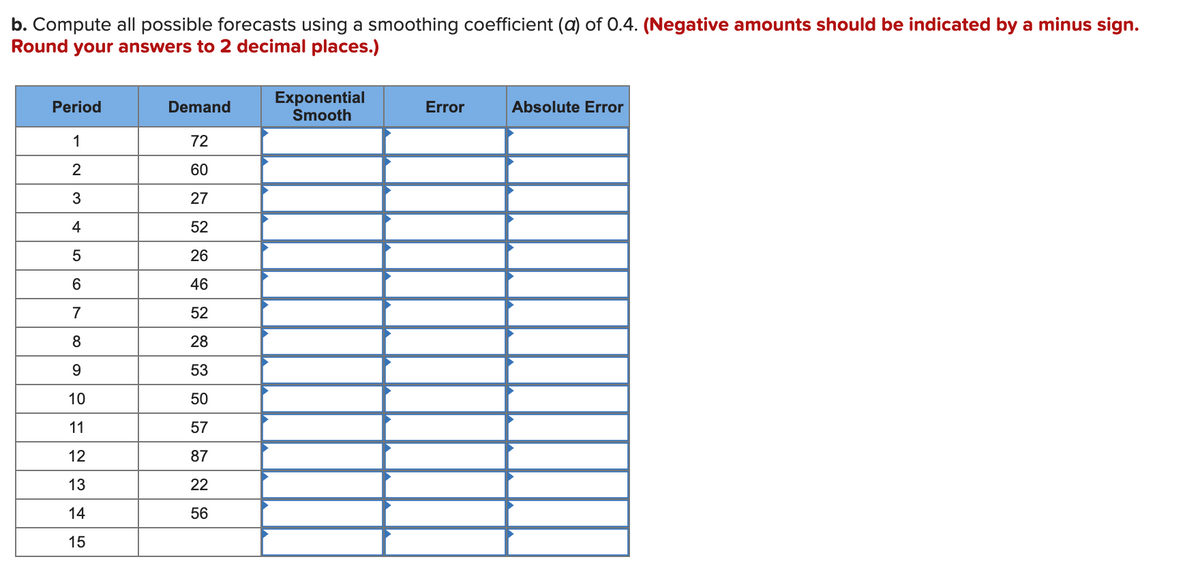
Transcribed Image Text:b. Compute all possible forecasts using a smoothing coefficient (a) of 0.4. (Negative amounts should be indicated by a minus sign.
Round
your answers to 2 decimal places.)
Exponential
Smooth
Period
Demand
Error
Absolute Error
1
72
60
27
4
52
5
26
6
46
7
52
8
28
9
53
10
50
11
57
12
87
13
22
14
56
15
Expert Solution
This question has been solved!
Explore an expertly crafted, step-by-step solution for a thorough understanding of key concepts.

This is a popular solution!

Trending now
This is a popular solution!

Step by step
Solved in 5 steps with 11 images

Knowledge Booster


Learn more about
Need a deep-dive on the concept behind this application? Look no further. Learn more about this topic, statistics and related others by exploring similar questions and additional content below.Recommended textbooks for you
Linear Algebra: A Modern Introduction
Algebra
ISBN:
9781285463247
Author:
David Poole
Publisher:
Cengage Learning

Glencoe Algebra 1, Student Edition, 9780079039897…
Algebra
ISBN:
9780079039897
Author:
Carter
Publisher:
McGraw Hill

College Algebra
Algebra
ISBN:
9781305115545
Author:
James Stewart, Lothar Redlin, Saleem Watson
Publisher:
Cengage Learning
Linear Algebra: A Modern Introduction
Algebra
ISBN:
9781285463247
Author:
David Poole
Publisher:
Cengage Learning
Glencoe Algebra 1, Student Edition, 9780079039897…
Algebra
ISBN:
9780079039897
Author:
Carter
Publisher:
McGraw Hill
College Algebra
Algebra
ISBN:
9781305115545
Author:
James Stewart, Lothar Redlin, Saleem Watson
Publisher:
Cengage Learning

Algebra and Trigonometry (MindTap Course List)
Algebra
ISBN:
9781305071742
Author:
James Stewart, Lothar Redlin, Saleem Watson
Publisher:
Cengage Learning