Using simple exponential smoothing and the following time series data, respond to each of the items. Period. Demand
Using simple exponential smoothing and the following time series data, respond to each of the items. Period. Demand

Glencoe Algebra 1, Student Edition, 9780079039897, 0079039898, 2018
18th Edition
ISBN:9780079039897
Author:Carter
Publisher:Carter
Chapter10: Statistics
Section10.1: Measures Of Center
Problem 9PPS

Related questions
Question
2//
Using simple exponential smoothing and the following time series data, respond to each of the items.
Period. Demand
1. 104
2. 132
3. 143
4. 137
5. 146
6. 150
7. 101
8. 126
9. 116
10. 115
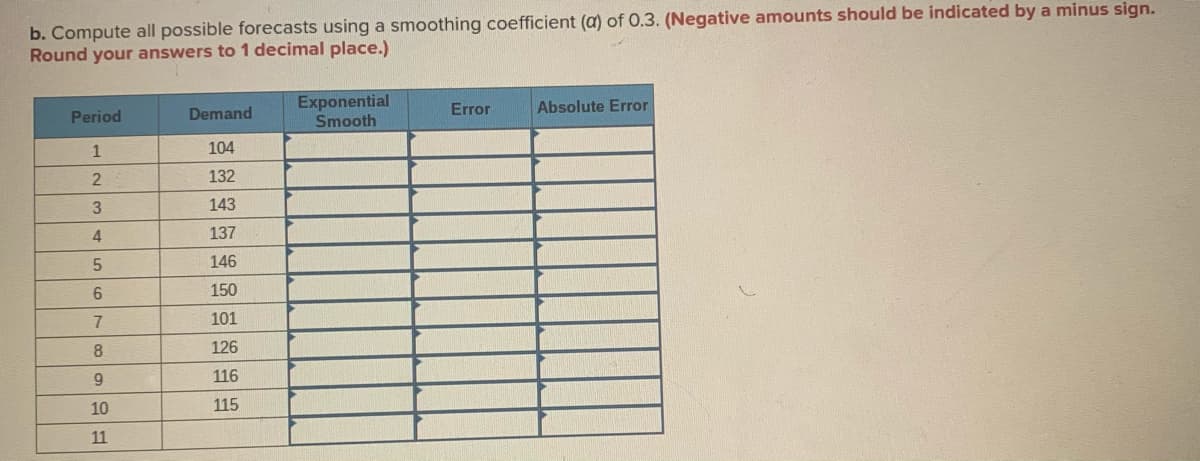
Transcribed Image Text:b. Compute all possible forecasts using a smoothing coefficient (a) of O.3. (Negative amounts should be indicated by a minus sign.
Round your answers to 1 decimal place.)
Exponential
Error
Absolute Error
Period
Demand
Smooth
1
104
2
132
143
4
137
146
6.
150
7
101
8
126
9
116
10
115
11
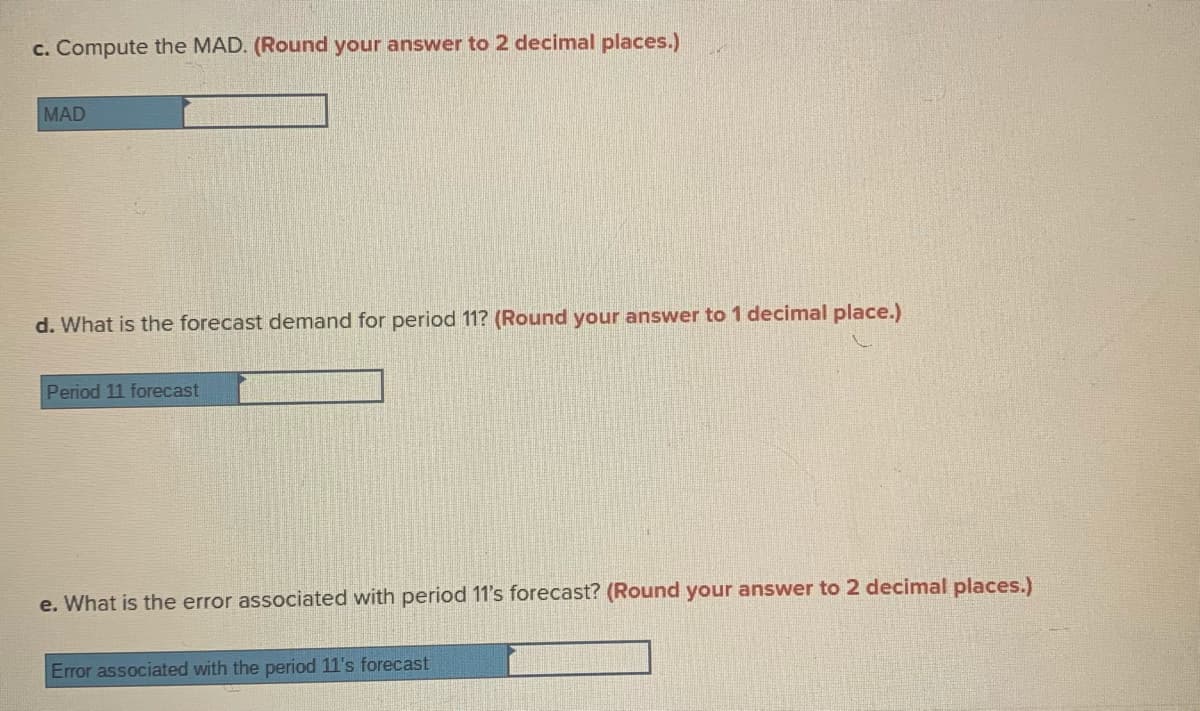
Transcribed Image Text:c. Compute the MAD. (Round your answer to 2 decimal places.)
MAD
d. What is the forecast demand for period 11? (Round your answer to 1 decimal place.)
Period 11 forecast
e. What is the error associated with period 11's forecast? (Round your answer to 2 decimal places.)
Error associated with the period 11's forecast
Expert Solution
This question has been solved!
Explore an expertly crafted, step-by-step solution for a thorough understanding of key concepts.

This is a popular solution!

Trending now
This is a popular solution!

Step by step
Solved in 5 steps with 7 images

Knowledge Booster


Learn more about
Need a deep-dive on the concept behind this application? Look no further. Learn more about this topic, statistics and related others by exploring similar questions and additional content below.Recommended textbooks for you
Glencoe Algebra 1, Student Edition, 9780079039897…
Algebra
ISBN:
9780079039897
Author:
Carter
Publisher:
McGraw Hill

Algebra & Trigonometry with Analytic Geometry
Algebra
ISBN:
9781133382119
Author:
Swokowski
Publisher:
Cengage
Glencoe Algebra 1, Student Edition, 9780079039897…
Algebra
ISBN:
9780079039897
Author:
Carter
Publisher:
McGraw Hill
Algebra & Trigonometry with Analytic Geometry
Algebra
ISBN:
9781133382119
Author:
Swokowski
Publisher:
Cengage