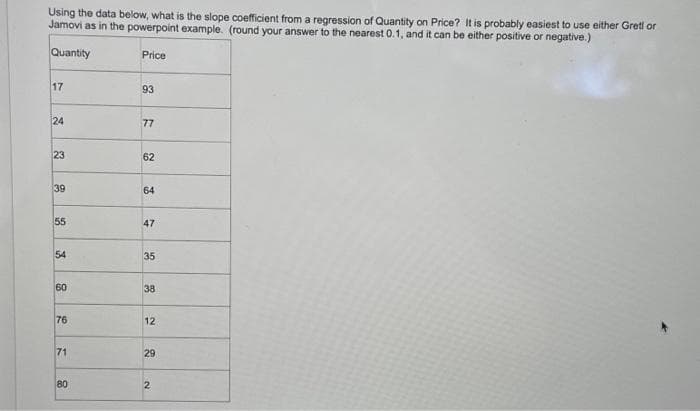
Using the data below, what is the slope coefficient from a regression of Quantity on Price? It is probably easiest to use either Grett or Jamovi as in the powerpoint example. (round your answer to the nearest 0.1, and it can be either positive or negative.) Quantity Price 17 24 23 39 55 54 60 76 71 80 93 77 62 64 47 35 38 12 29 2


Q: Imagine a 45°-line (Keynesian cross) diagram in which the upward-sloping aggregate expenditure curve…
A: Macroeconomic monitoring will remain critical since it determines the economy's final expansion path…
Q: 10 9 8 7 CO 6 5 4 3 2 • Label axis variables • Label curves ● Highlight the market envelope • Draw…
A: The principle of compensating wages explains why some employees receive higher pay than others,…
Q: Mortgage lenders require the borrowers to make a 20% down payment. Otherwise, private mortgage…
A: Asymmetric information refers to the problem when one party has more information about the good or…
Q: Refer to the figure below. Assume Cliff and Paul were both producing wheat and corn, and each person…
A: A country has less opportunity cost as compared to other countries, it will have comparative…
Q: 0. If supply changes from S2 to S1 and demand changes from D1 to D2 (a) equilibrium price…
A: it can be described as a type of good in which goods are consumed with other goods The demand for a…
Q: Two consequences of asymmetric information are adverse selection and moral hazard. An important…
A: Adverse selection happens when one party in a transaction has more or preferred information over the…
Q: The economics discipline assumes that the goal of a consumer is: O to maximize knowledge and…
A: To identify the assumed goal of a consumer in economics, we need to examine the fundamental…
Q: 4. Individual and market supply Suppose that Antonio and Caroline are the only suppliers of shoes in…
A: Market supply refers to the total quantity of a specific good or service that all producers or…
Q: Suppose that Nathan Juarez is the only seller of kumquats in a small town. The following graph shows…
A: Total revenue is the amount earned by the firm by selling its product. Total revenue is price times…
Q: Click to see additional instructions When supplying labour for universities, academics are aware…
A: The laws of demand and supply highlight the higher the price, the less the demand, while supply will…
Q: Complete the following table and answer one question. a. Assuming an 8 percent sales tax is levied…
A: The tax is a compulsory or mandatory levy paid by an individual. It may be either collected direct…
Q: Solve for the following a) investment: b) Private saving: c) public saving
A: An economic system that is not involved in international trade or any other economic transactions…
Q: You are given the following information about aggregate demand at the existing price level for an…
A: In economics, full employment level refers to a situation in which the labor market operates…
Q: There are limited resources to satisfy all of society's wants. Oscarcity O entrepreneurship O…
A: A resource is whatever can be utilized to satisfy a need or want. Resources can be natural, like…
Q: 11. Calculating the price elasticity of supply Yakov is a volunteer fire fighter living in Chicago…
A: Demand elasticity is the degree to which consumer demand for a good responds to changes in variables…
Q: A company that produces cleaning products is considering a proposal to begin production of a new…
A: Total revenue is the product of price and quantity. Total cost is the cost of producing all the…
Q: Market efficiency and market fallure The following graph shows equalibrium in a free market, with…
A: The external cost is an activity that affects other parties. It may be cost or benefit to the…
Q: How do unemployment rates and economic growth affect individuals, businesses, communities, and the…
A: Unemployment refers to the state at which people who are actively looking for the job but are unable…
Q: a. Draw a graph showing Acadia's ADo, ADI, ASo, and ASI. Plot only the endpoints of the two…
A: Note: Since you have posted a question with multiple sub parts, we will provide the solution only to…
Q: Suppose the market for peanut butter experiences the following event: An increase in peanut…
A: A market equilibrium refers to a situation at which the demand is equal to the supply in the…
Q: a monopolistically competitive firm maximizes profits when it O produces the quantity at which…
A: Monopolistic competition is a kind of market structure in which there are numerous sellers offering…
Q: choose one in the brackets to fill in for the following question: If the wage rate for workers in…
A: “Since you have asked multiple questions, we will solve the first question for you. If you want any…
Q: What property does it display? O increasing returns diminishing returns O constant returns O…
A: A production function is a mathematical equation that describes the relationship between the…
Q: Exercise 1: Consumer Choice Application Labor-Leisure Choice Barbie has preferences over bundles of…
A: A budget line shows a combination of two goods that consumers can purchase at the current price at a…
Q: Assume that the /S-MP model on the right shows an economy that was in long-run macroeconomic…
A: Economics refers to the social science that studies the production, distribution, and consumption of…
Q: Luisa cannot tell the difference between rice and wheat and spends all her food budget of $48/wk on…
A: Let's Construct a price-consumption curve based on the information you provided about Luisa's wheat…
Q: Compared to before the pandemic, the number of unemployment payments arriving in a timely manner has…
A: Compared to the time before the pandemic, the number of unemployment benefits on time differed…
Q: Refer to FIGURE 1. FIGURE 1 Food 80 60 40 20 E B L L 20 40 60 80 100 110 120 140 160 180 200…
A: Ans. The Production Possibility Frontier(PPF) shows all the possible combinations of two goods when…
Q: Why are Americans planning on cutting back on spending through the holiday
A: It can be described as the network of an organization that involves the production activities,…
Q: 41 An engineer borrowed $3000 from the bank, payable in six equal end-of-year payments at 8%. The…
A: Amount borrowed=$3000Interest rate=8%Number of end year payment=6 Year end paymentPlease find…
Q: The following graph shows a demand curve (in blue) and a supply curve (in orange). Suppose a price…
A: The government-legislated maximum price that can be charged for a particular product or service is…
Q: How do you correlate your answers in the previous questions with the phases of economic cycles and…
A: Economic cycles, also known as business cycles, refer to the recurring fluctuations in economic…
Q: Germany is the European Union’s largest economy. Suppose that it produces two goods: electricity and…
A: Two goods are produced in the economy : Electricity & Food Electricity is capital intensive…
Q: OD. What kind of government will the society have, how will it be run, and who will run it?…
A: A centrally planned economy is one in which the government undertakes the production of goods and…
Q: Draw a graph for conducting a benefit cost analysis using marginal analysis. Solve for the efficient…
A: Marginal benefit curve is downward sloping because the abatement increase , each additional unit of…
Q: True or false The jobs in domestic market and the jobs which have higher wages for labors compared…
A: Wage refers to the compensation or payment that an employer provides to an employee in exchange for…
Q: a. Explain how comparative advantage and opportunity cost affect trade. b. In your opinion, state…
A: The exchange of goods or services between individuals, firms, or nations is termed trade. It is an…
Q: A firm faces the following demand and cost functions: Q=2000-4P TC = 2500 + 80Q-.75Q² +0³ Find the…
A: Profit-Maximizing Condition:The profit-maximizing condition for a firm occurs when the firm produces…
Q: Suppose that GDP equals $10 trillion, consumption equals $6.5 trillion, and the government spends $2…
A: Gross Domestic Product (GDP) is a key economic indicator that represents the total monetary or…
Q: Employees at the Jackson Hole Corporation typically take forty-five minutes for lunch when the…
A: Agency costs refer to the expenses and inefficiencies that arise in a business organization when…
Q: 5. The price of trade Suppose that Ireland and Norway both produce olive oil and broccoli. Ireland's…
A: Comparative advantage is an economic principle that refers to the ability of an individual, firm, or…
Q: Suppose an individual consumes goods and y and has income I. The prices are pa and p, respectively.…
A: Utility refers to the measure of satisfaction or happiness that an individual derives from consuming…
Q: In the simple deposit expansion model, an expansion in checkable deposits of $1,000 when the…
A: The Simple Deposit Expansion Model, often referred to as the money multiplier model, is a simplified…
Q: f you advertise and your rival advertises, you each will earn $4 million in profits. If neither of…
A: A game consists of players, strategies and their respective payoffs. Strategies are action plans…
Q: A solid-waste recycling plant is considering two types of storage bins. Use ROR evaluation and an…
A: Rate of Return (ROR) is a financial metric that measures the profitability of an investment. It is…
Q: Hula Products has reintroduced the hula hoop to the world and faces a growing demand for its product…
A: Demand: Demand refers to the quantity of a good or service that consumers are willing and able to…
Q: Suppose that Raphael and Susan are the only suppliers of pieces of cake in some hypothetical market.…
A: The supply curve is the upward sloping curve. The supply schedule is the tabular representation of…
Q: In this market, the equilibrium wage is s Suppose the mayor of Combopolis Introduces a legal minimum…
A: The labour market is a high priority in both micro and macroeconomics because it has the possibility…
Q: The following table shows data on a hypothetical country's real GDP from 1980 through 1988: Real GDP…
A: Annual real GDP growth refers to the percentage increase in a country's Gross Domestic Product (GDP)…
Q: Assuming a $6 per unit tax is imposed, what will be the quantity traded? (a) 4 (b) 8…
A: Whenever the government imposes a tax on a product, the production cost of that product increases.…
Using the data below, what is the slope coefficient from a regression of Quantity on Price? It is probably easiest to use either Gretl or Jamovi as in the powerpoint example. (round your answer to the nearest 0.1, and it can be either positive or negative.)
Quantity 17 24 23 39 55 54 60 76 71 80
Price 93 77 62 64 47 35 38 12 29 2


Trending now
This is a popular solution!

Step by step
Solved in 3 steps with 3 images


- Hello, I am trying to find the equations on my calculator for the price-demand and price supply equations. The data is in the attached image. I think I am doing something wrong, but not sure what. I found the quadratic regression model for the first set of data using my calculator, but I used the p=D(x) as list one, and x, as list two. I came up with 0.028x^2-23x +5743 is this right? or do I need the reverse the order? For the price-supply data I but the p=S(x) as list 1 and x as list 2 and I got the linear regression function: 2 5.1x+342 Can you please let me know if I am on the right track?The following data relate the sales figures of the bar in Mark Kaltenbach's small bed-and-breakfast inn in portland, to the number of guest registered that week: week guests bar sales 1 16 $330 2 12 $270 3 18 $380 4 14 $315 a) The simple linear regression equation that relates bar sales to number of guests(not to time) is (round your responses to one decimal place): Bar sales = [___]+[___]X guestsPlease no written by hand and no emage Your company, which specializes in running shoes for men who are growing increasingly follicly-challenged (BalderDash®), has the following demand function: Q = a + bP + cM + dR where Q is the quantity demanded of BalderDash’s most popular shoes, P is the price of that product, M is consumer income, and R is the price of a related product. The regression results are: Adjusted R Square 0.7796 Independent Variables Coefficients Standard Error t Stat P-value Intercept 21,055.04 1428.27 14.74 8.1E-16 P -83.912 19.079 -4.398 0.000 M 0.0266 0.013 2.064 0.047 R -16.6 10.664 -1.556 0.129 Discuss whether you think these regression results will generate good sales estimates for BalderDash. Now assume that the income is $69,100, the price of the related good is $39, and BalderDash chooses to set the price of its product at $54. b. What is the estimated number of units sold given the data above? (round to nearest unit; no decimals) c.…
- General Cereals is using a regression model to estimate the demand for Tweetie Sweeties, a whistle-shaped, sugar-coated breakfast cereal for children. The following (multiplicative exponential) demand function is being used: QD=6,280 P(−1.85)A2.05N2.70QD=6,280 P−1.85A2.05N2.70 where QDQD = quantity demanded, in 10-oz boxes PP = price per box, in dollars AA = advertising expenditures on daytime television, in dollars NN = proportion of the population under 12 years old, in percent What is the point price elasticity of demand for Tweetie Sweeties? 2.05 2.70 -0.90 -1.85 What is the advertising elasticity of demand? 0.76 -1.85 2.70 2.05Imagine that you work for the maker of a leading brand of low-calorie, frozen microwavable food that estimates the following demand equation for its product using data from 26 supermarkets around the country for the month of April. Note: The following is a regression equation. Standard errors are in parentheses for the demand for widgets. QD = - 5200 - 42P + 20PX + 5.2I + 0.20A + 0.25M (2.002) (17.5) (6.2) (2.5) (0.09) (0.21) R2 = 0.55 n = 26 F = 4.88 Your supervisor has asked you to compute the elasticities for each independent variable. Assume the following values for the independent variables: Q = Quantity demanded of 3-pack units P (in cents) = Price of the product = 500 cents per 3-pack unit PX (in cents) = Price of leading competitor's product = 600 cents per 3-pack unit I (in dollars) = Per capita income of the standard metropolitan statistical area (SMSA) in…Consider the following data regarding students' college GPAs and high school GPAs. The estimated regression equation is Estimated College GPA=1.85+0.4743(High School GPA).Estimated College GPA=1.85+0.4743(High School GPA). GPAs College GPA High School GPA 3.843.84 2.562.56 3.573.57 3.903.90 2.072.07 3.143.14 4.004.00 3.223.22 3.873.87 2.882.88 2.212.21 2.082.08 Copy Data Step 1 of 3 : Compute the sum of squared errors (SSE) for the model. Round your answer to four decimal places.
- Suppose you run a regression with quantity as your dependent variable and advertising as one of your independent variables. The p-value on advertising is .08. The marketing team is arguing that their advertising efforts are impacting sales, but the finance/economics department is arguing that there isn't evidence that the advertising is impacting sales. What side would you take and why?Suppose that an economist has been able to gather data on the relationship between demand and price for a particular product. After analyzing scatterplots and using economic theory, the economist decides to estimate an equation of the form Q= aPb, where Q is quantity demanded and P is price. An appropriate regression analysis is then performed, and the estimated parameters turn out to be a = 1000 and b = - 1.3. Now consider two scenarios: (1) the price increases from $10 to $12.50; (2) the price increases from $20 to $25. a. Do you predict the percentage decrease in demand to be the same in scenario 1 as in scenario 2? Why or why not? b. What is the predicted percentage decrease in demand in scenario 1? What about scenario 2? Be as exact as possible.Q. Wilpen Company, a price-setting firm, produces nearly 80 percent of all tennis balls purchased in the United States. Wilpen estimates the U.S. demand for its tennis balls by using the following linear specification: Q = a + bP + cM + dPR. Where Q is the number of cans of tennis balls sold quarterly, P is the wholesale price Wilpen charges for a can of tennis balls, M is the consumers’ average household income, and PR is the average price of tennis rackets. The regression results are as follows: a- Discuss the statistical significance of the parameter estimates a^, b^, c^, and d^ using the p-values. Are the signs of b^, c^, and d^ consistent with the theory of demand? Wilpen plans to charge a wholesale price of $1.65 per can. The average price of a tennis racket is $110, and consumers’ average household income is $24,600. b. What is the estimated number of cans of tennis balls demanded? c) At the values of P, M, and Pr given, what are the estimated values of the price (E^), income…
- Q. Wilpen Company, a price-setting firm, produces nearly 80 percent of all tennis balls purchased in the United States. Wilpen estimates the U.S. demand for its tennis balls by using the following linear specification: Q = a + bP + cM + dPR. Where Q is the number of cans of tennis balls sold quarterly, P is the wholesale price Wilpen charges for a can of tennis balls, M is the consumers’ average household income, and PR is the average price of tennis rackets. The regression results are as follows: a. Discuss the statistical significance of the parameter estimates a^, b^, c^, and d^ using the p-values. Are the signs of b^, c^, and d^ consistent with the theory of demand? Wilpen plans to charge a wholesale price of $1.65 per can. The average price of a tennis racket is $110, and consumers’ average household income is $24,600. b. What is the estimated number of cans of tennis balls demanded? c) At the values of P, M, and Pr given, what are the estimated values of the price (E^), income…Given the following data X (consumers of teff) or popn 3 6 8 1 13 13 14 Y ( teff consumption) 8 6 10 12 12 14 20 year 2013 2014 2015 2016 2017 2018 2019 Estimate the regression equation, Y= a+bX, Where Y denotes demand for teff while X is consumers of teff (population) By assuming demand for teff is only affected by its consumers, find the amount demand for teff in the year 2022 if the populations (consumers of teff) are about 18 people? (Hint: use the least square method, parameter a and b can be estimated by solving the two linear equations) SY= na+ bSX SXY=aSX +b Where n is number of years. For example, Estimate the sales for 2012, 2015 and fit a linear regression equation and draw a trend line.ar X Sales (Y) XY X2 year X Sales (Y) XY X2 2002 1 22734 22734 1 2003 2 24731 49462 4 2004 3 31489 94467 9 2005 4 44685 178740 16 2006 5 55319…Imagine you are trying to explain the effect of square footage on home sale prices in the United States. You collect a random sample of 100,000 homes that recently sold. a) Homes can be one of three types: single-family houses, townhomes, or condos. How would you control for a home’s type in a regression model? b) Write down a regression model that includes controls for home type, square footage, and number of bedrooms. c) How would you interpret the es3mated coefficients for each of the variables from part b? Be specific.