Using the data from 2022 in Gaming Table Cost Data, create an Excel spreadsheet to provide a sensitivity analysis of the effect on operating profit of potential changes in demand for HFI Incorporated, ranging from a 20 percent decrease to a 20 percent increase. Use Contribution Income Statements and What-If Sensitivity Analysis as a guide. Assume that two-thirds of fixed costs are manufacturing related; the remaining one-third are selling-related. The variable manufacturing cost per unit is $30, while the variable selling cost per unit is $5. (Hint: Calculate the DOL for 2022 at a sales volume of 3,000 units.) (Input your answer as a percentage rounded to 2 decimal places (i.e., 0.1567 = 15.67%).) DOL (Degree of operating leverage) ___% Using the spreadsheet you created, compute the new operating profit assuming a 10% decrease in demand. Operating Profit $____


Cost-Volume-Profit Analysis
Cost Volume Profit (CVP) analysis is a cost accounting method that analyses the effect of fluctuating cost and volume on the operating profit. Also known as break-even analysis, CVP determines the break-even point for varying volumes of sales and cost structures. This information helps the managers make economic decisions on a short-term basis. CVP analysis is based on many assumptions. Sales price, variable costs, and fixed costs per unit are assumed to be constant. The analysis also assumes that all units produced are sold and costs get impacted due to changes in activities. All costs incurred by the company like administrative, manufacturing, and selling costs are identified as either fixed or variable.
Marginal Costing
Marginal cost is defined as the change in the total cost which takes place when one additional unit of a product is manufactured. The marginal cost is influenced only by the variations which generally occur in the variable costs because the fixed costs remain the same irrespective of the output produced. The concept of marginal cost is used for product pricing when the customers want the lowest possible price for a certain number of orders. There is no accounting entry for marginal cost and it is only used by the management for taking effective decisions.
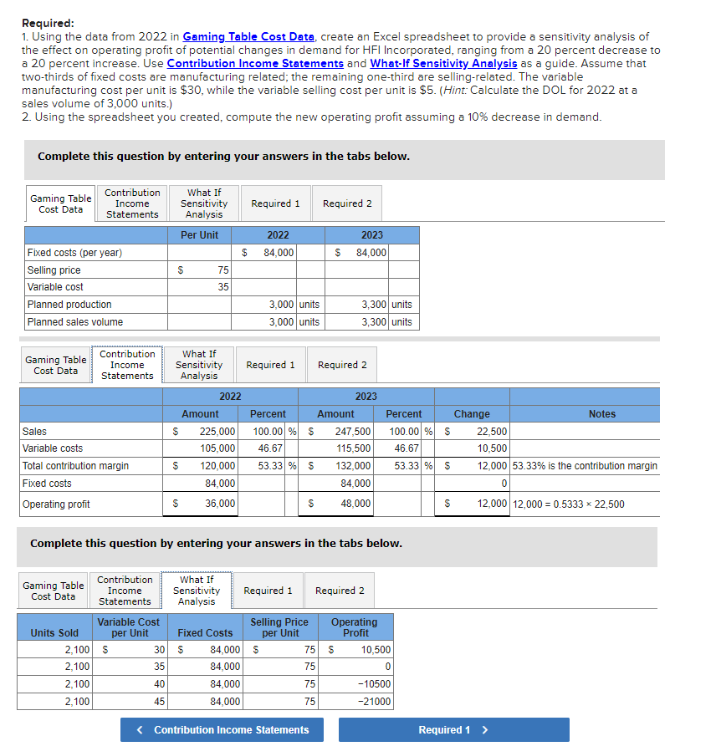
Using the data from 2022 in Gaming Table Cost Data, create an Excel spreadsheet to provide a sensitivity analysis of the effect on operating profit of potential changes in demand for HFI Incorporated, ranging from a 20 percent decrease to a 20 percent increase. Use Contribution Income Statements and What-If Sensitivity Analysis as a guide. Assume that two-thirds of fixed costs are manufacturing related; the remaining one-third are selling-related. The variable
DOL (Degree of operating leverage) ___%
Using the spreadsheet you created, compute the new operating profit assuming a 10% decrease in demand.
Operating Profit $____


Trending now
This is a popular solution!

Step by step
Solved in 2 steps


