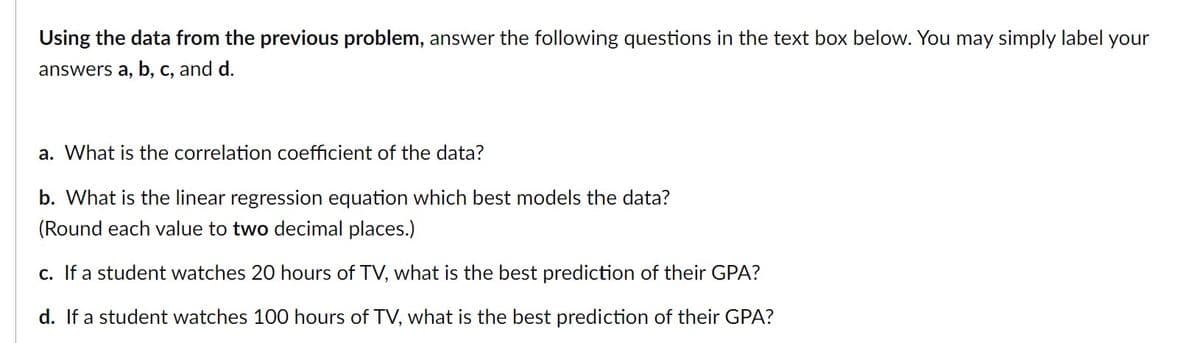
Using the data from the previous problem, answer the following questions in the text box below. You may simply label your answers a, b, c, and d. a. What is the correlation coefficient of the data? b. What is the linear regression equation which best models the data? (Round each value to two decimal places.) c. If a student watches 20 hours of TV, what is the best prediction of their GPA? d If a student watches 100 bours of TV what is the best prediction of their GPA?


Correlation
Correlation defines a relationship between two independent variables. It tells the degree to which variables move in relation to each other. When two sets of data are related to each other, there is a correlation between them.
Linear Correlation
A correlation is used to determine the relationships between numerical and categorical variables. In other words, it is an indicator of how things are connected to one another. The correlation analysis is the study of how variables are related.
Regression Analysis
Regression analysis is a statistical method in which it estimates the relationship between a dependent variable and one or more independent variable. In simple terms dependent variable is called as outcome variable and independent variable is called as predictors. Regression analysis is one of the methods to find the trends in data. The independent variable used in Regression analysis is named Predictor variable. It offers data of an associated dependent variable regarding a particular outcome.
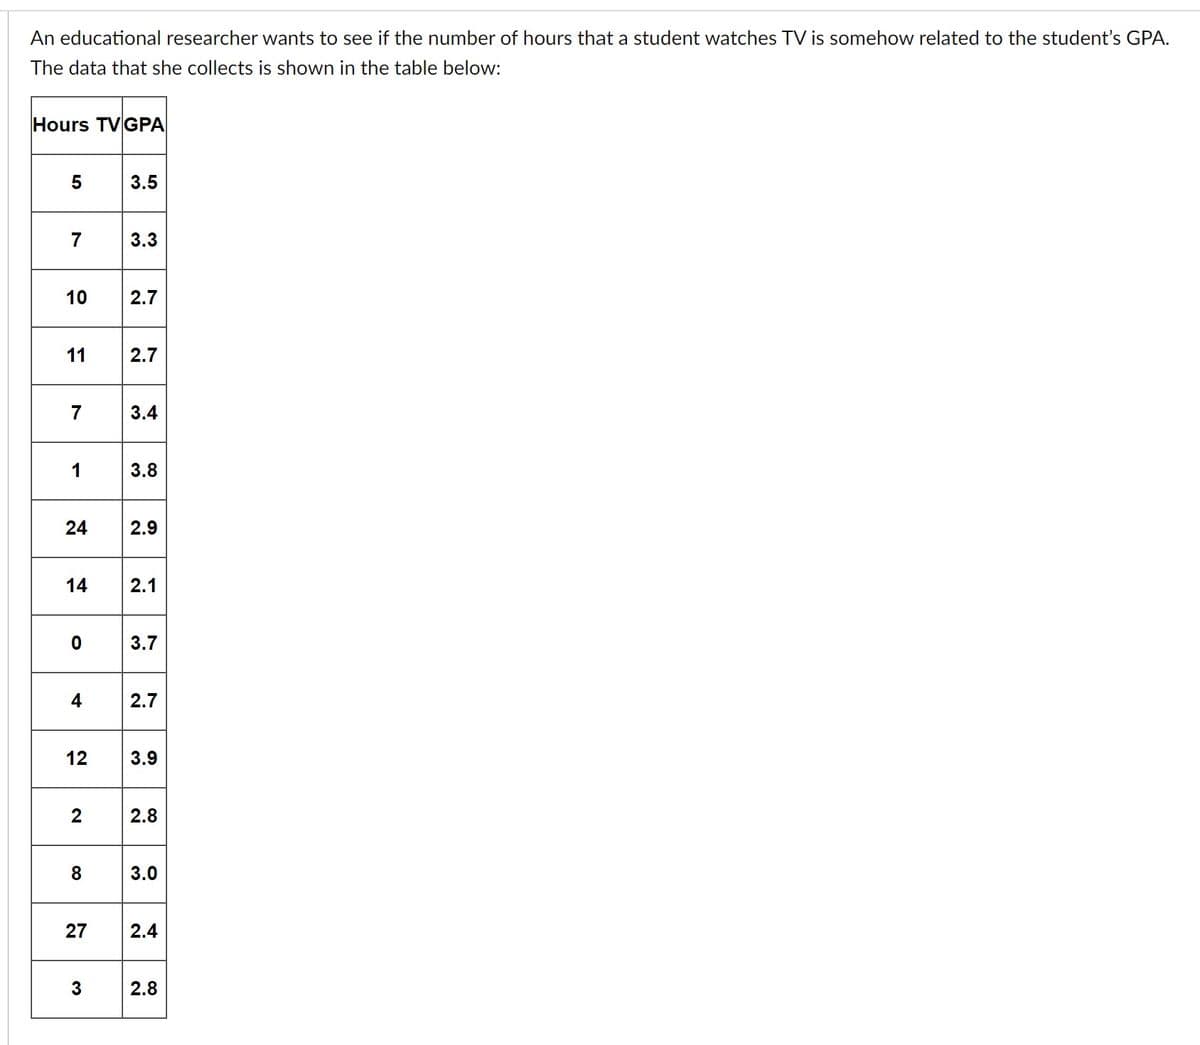
From given data,
| X | Y | X*Y | X*X | Y*Y |
| 5 | 3.5 | 17.5 | 25 | 12.25 |
| 7 | 3.3 | 23.1 | 49 | 10.89 |
| 10 | 2.7 | 27 | 100 | 7.29 |
| 11 | 2.7 | 29.7 | 121 | 7.29 |
| 7 | 3.4 | 23.8 | 49 | 11.56 |
| 1 | 3.8 | 3.8 | 1 | 14.44 |
| 24 | 2.9 | 69.6 | 576 | 8.41 |
| 14 | 2.1 | 29.4 | 196 | 4.41 |
| 0 | 3.7 | 0 | 0 | 13.69 |
| 4 | 2.7 | 10.8 | 16 | 7.29 |
| 12 | 3.9 | 46.8 | 144 | 15.21 |
| 2 | 2.8 | 5.6 | 4 | 7.84 |
| 8 | 3.0 | 24 | 64 | 9 |
| 27 | 2.4 | 64.8 | 729 | 5.76 |
| 3 | 2.8 | 8.4 | 9 | 7.84 |


Step by step
Solved in 4 steps with 3 images


