Several growers are happy with this advancement in technology because now they can sell more crops, which they believe will lead to increases in revenue. Using elasticities, you will be able to determine whether this price change will lead to a rise or fall in total revenue in this market. Using the midpoint method, the price elasticity of demand for cashews between the price levels of $20 and $12 per ton is between these two points, demand is . Thus, you can conclude that the grower's claim is due to the technological improvement. , meaning that because total revenue will Confirm your previous conclusion by calculating total revenue in the cashew market before and after the technological improvement. Enter these values in the following table. Total Revenue (Thousands of Dollars) Before Technological Improvement After Technological Improvement
Several growers are happy with this advancement in technology because now they can sell more crops, which they believe will lead to increases in revenue. Using elasticities, you will be able to determine whether this price change will lead to a rise or fall in total revenue in this market. Using the midpoint method, the price elasticity of demand for cashews between the price levels of $20 and $12 per ton is between these two points, demand is . Thus, you can conclude that the grower's claim is due to the technological improvement. , meaning that because total revenue will Confirm your previous conclusion by calculating total revenue in the cashew market before and after the technological improvement. Enter these values in the following table. Total Revenue (Thousands of Dollars) Before Technological Improvement After Technological Improvement

Economics: Private and Public Choice (MindTap Course List)
16th Edition
ISBN:9781305506725
Author:James D. Gwartney, Richard L. Stroup, Russell S. Sobel, David A. Macpherson
Publisher:James D. Gwartney, Richard L. Stroup, Russell S. Sobel, David A. Macpherson
Chapter10: Dynamic Change, Economic Fluctuations, And The Ad-as Model
Section: Chapter Questions
Problem 3CQ

Related questions
Question
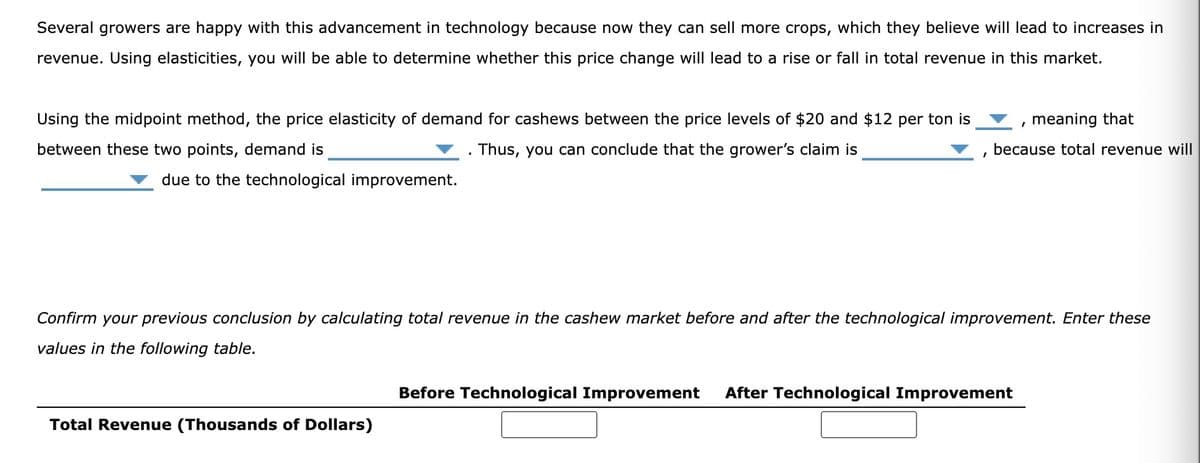
Transcribed Image Text:Several growers are happy with this advancement in technology because now they can sell more crops, which they believe will lead to increases in
revenue. Using elasticities, you will be able to determine whether this price change will lead to a rise or fall in total revenue in this market.
Using the midpoint method, the price elasticity of demand for cashews between the price levels of $20 and $12 per ton is
between these two points, demand is
Thus, you can conclude that the grower's claim is
due to the technological improvement.
I
Total Revenue (Thousands of Dollars)
meaning that
because total revenue will
Confirm your previous conclusion by calculating total revenue in the cashew market before and after the technological improvement. Enter these
values in the following table.
Before Technological Improvement After Technological Improvement
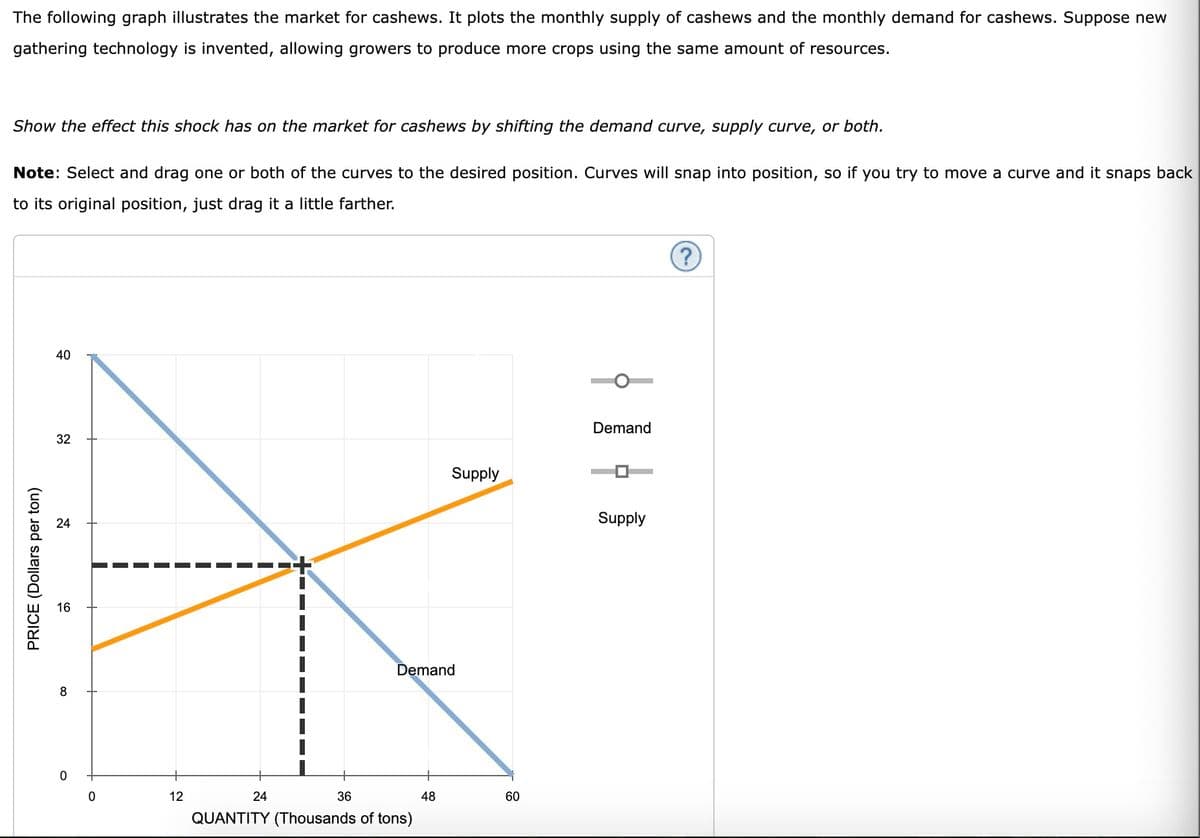
Transcribed Image Text:The following graph illustrates the market for cashews. It plots the monthly supply of cashews and the monthly demand for cashews. Suppose new
gathering technology is invented, allowing growers to produce more crops using the same amount of resources.
Show the effect this shock has on the market for cashews by shifting the demand curve, supply curve, or both.
Note: Select and drag one or both of the curves to the desired position. Curves will snap into position, so if you try to move a curve and it snaps back
to its original position, just drag it a little farther.
PRICE (Dollars per ton)
40
32
16
8
0
0
12
24
36
Demand
QUANTITY (Thousands of tons)
Supply
48
60
Demand
Supply
?
Expert Solution
This question has been solved!
Explore an expertly crafted, step-by-step solution for a thorough understanding of key concepts.

This is a popular solution!

Trending now
This is a popular solution!

Step by step
Solved in 4 steps with 2 images

Follow-up Questions
Read through expert solutions to related follow-up questions below.
Follow-up Question
Using the midpoint method, the
Solution
Knowledge Booster


Learn more about
Need a deep-dive on the concept behind this application? Look no further. Learn more about this topic, economics and related others by exploring similar questions and additional content below.Recommended textbooks for you
Economics: Private and Public Choice (MindTap Cou…
Economics
ISBN:
9781305506725
Author:
James D. Gwartney, Richard L. Stroup, Russell S. Sobel, David A. Macpherson
Publisher:
Cengage Learning

Macroeconomics: Private and Public Choice (MindTa…
Economics
ISBN:
9781305506756
Author:
James D. Gwartney, Richard L. Stroup, Russell S. Sobel, David A. Macpherson
Publisher:
Cengage Learning

Economics: Private and Public Choice (MindTap Cou…
Economics
ISBN:
9781305506725
Author:
James D. Gwartney, Richard L. Stroup, Russell S. Sobel, David A. Macpherson
Publisher:
Cengage Learning
Macroeconomics: Private and Public Choice (MindTa…
Economics
ISBN:
9781305506756
Author:
James D. Gwartney, Richard L. Stroup, Russell S. Sobel, David A. Macpherson
Publisher:
Cengage Learning

Economics (MindTap Course List)
Economics
ISBN:
9781337617383
Author:
Roger A. Arnold
Publisher:
Cengage Learning

