Using the partial R output, answer the questions below. (a) Estimate the model. Use two-decimals your estimation of the slope term, no decimals in the estimation of the y-intercept. MonthlySales, = I Percent HSGrads, (b) What percentage of the variation in a store's monthly sales cannot be explained by its linear dependency on the percentage of the customer base that are high school graduates? Enter your answer as a percentage, using two decimal places.
Using the partial R output, answer the questions below. (a) Estimate the model. Use two-decimals your estimation of the slope term, no decimals in the estimation of the y-intercept. MonthlySales, = I Percent HSGrads, (b) What percentage of the variation in a store's monthly sales cannot be explained by its linear dependency on the percentage of the customer base that are high school graduates? Enter your answer as a percentage, using two decimal places.

Algebra & Trigonometry with Analytic Geometry
13th Edition
ISBN:9781133382119
Author:Swokowski
Publisher:Swokowski
Chapter7: Analytic Trigonometry
Section7.6: The Inverse Trigonometric Functions
Problem 93E

Related questions

Concept explainers
Contingency Table
A contingency table can be defined as the visual representation of the relationship between two or more categorical variables that can be evaluated and registered. It is a categorical version of the scatterplot, which is used to investigate the linear relationship between two variables. A contingency table is indeed a type of frequency distribution table that displays two variables at the same time.
Binomial Distribution
Binomial is an algebraic expression of the sum or the difference of two terms. Before knowing about binomial distribution, we must know about the binomial theorem.
Topic Video
Question
R-Studio. Thank you in advance!
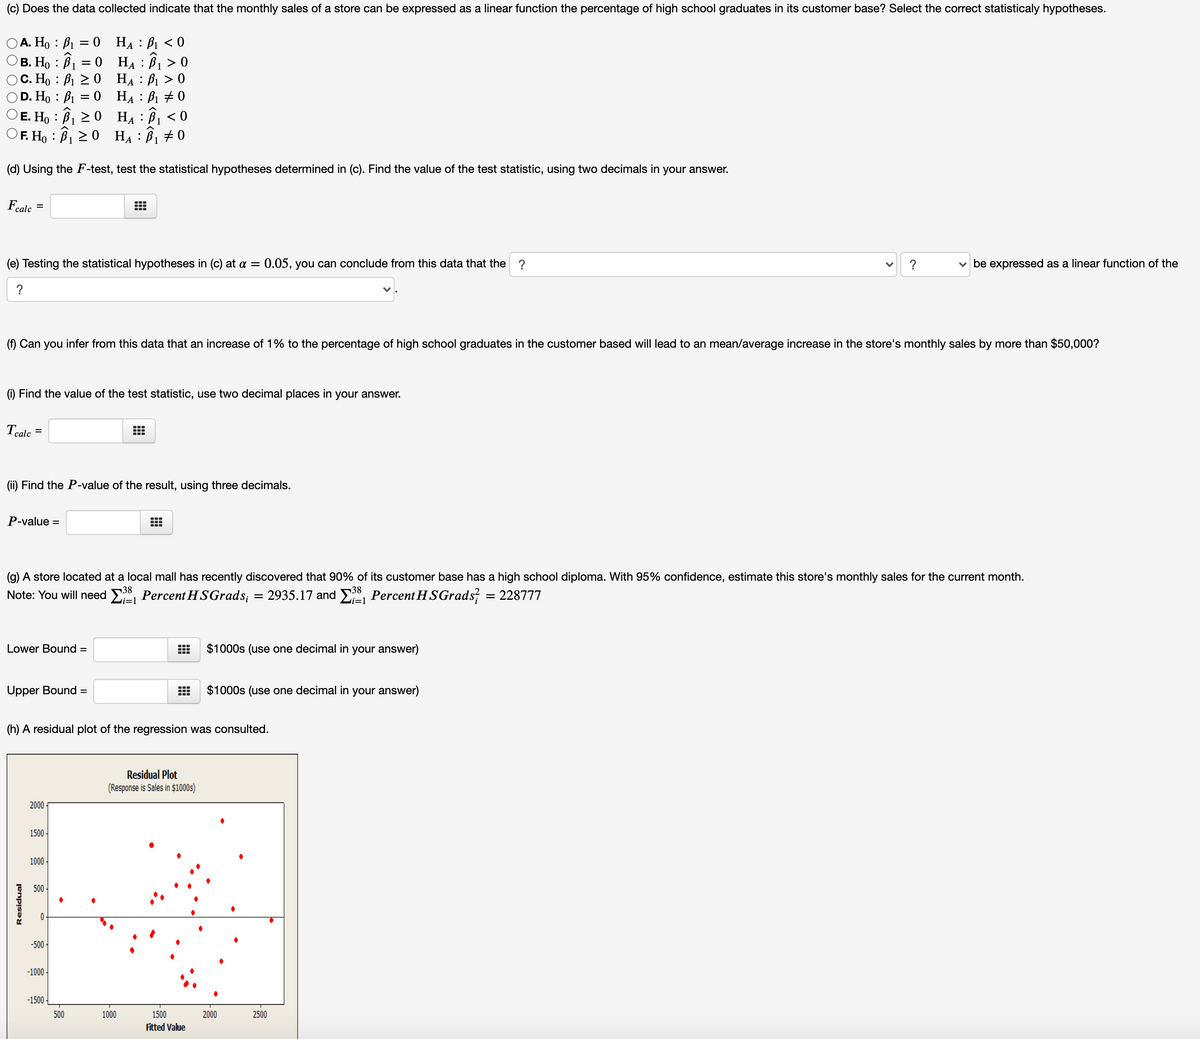
Transcribed Image Text:(c) Does the data collected indicate that the monthly sales of a store can be expressed as a linear function the percentage of high school graduates in its customer base? Select the correct statisticaly hypotheses.
А. Но : В1
В. Но : В — о На : В >0
C. Ho : B1 20 HẠ : B1 > 0
D. Ho : B1 = 0 HẠ : B1 + 0
E. Ho : B1 2 0 HẠ: B1 < 0
F. Ho : B1 > 0 HẠ : B1
0 HA : B1 < 0
(d) Using the F-test, test the statistical hypotheses determined in (c). Find the value of the test statistic, using two decimals in your answer.
Feale
%3D
(e) Testing the statistical hypotheses in (c) at a = 0.05, you can conclude from this data that the
?
?
v be expressed as a linear function of the
?
(f) Can you infer from this data that an increase of 1% to the percentage of high school graduates in the customer based will lead to an mean/average increase in the store's monthly sales by more than $50,000?
(i) Find the value of the test statistic, use two decimal places in your answer.
Tcalc
...
(ii) Find the P-value of the result, using three decimals.
P-value =
(g) A store located at a local mall has recently discovered that 90% of its customer base has a high school diploma. With 95% confidence, estimate this store's monthly sales for the current month.
38
38
Note: You will need E, Percent HSGrads; = 2935.17 and E, Percent H SGrads
= 228777
i=1
i=1
Lower Bound =
$1000s (use one decimal in your answer)
Upper Bound =
$1000s (use one decimal in your answer)
(h) A residual plot of the regression was consulted.
Residual Plot
(Response is Sales in $1000s)
2000
1500
1000 -
500 -
-500 -
-1000
-1500
500
1000
1500
2000
2500
Fitted Value
O O
Residual
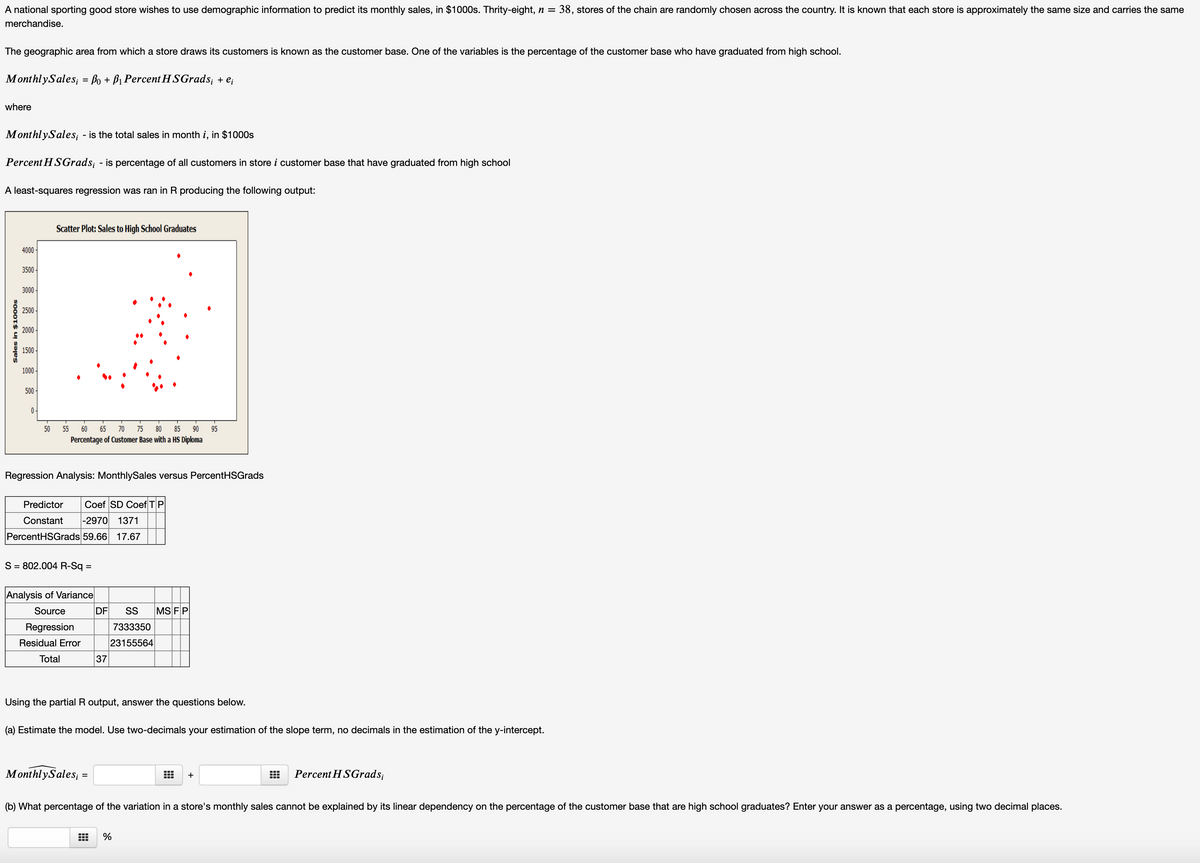
Transcribed Image Text:A national sporting good store wishes to use demographic information to predict its monthly sales, in $1000s. Thrity-eight, n =
38, stores of the chain are randomly chosen across the country. It is known that each store is approximately the same size and carries the same
merchandise.
The geographic area from which a store draws its customers is known as the customer base. One of the variables is the percentage of the customer base who have graduated from high school.
MonthlySales; = Bo + Bị Percent H SGrads; + e;
where
MonthlySales;
- is the total sales in month i, in $1000s
Percent H SGrads; - is percentage of all customers in store i customer base that have graduated from high school
A least-squares regression was ran in R producing the following output:
Scatter Plot: Sales to High School Graduates
4000 -
3500
3000 -
2500 -
2000
1500-
1000 -
500 -
0-
50
55
60
65
70
75
80
85
90
95
Percentage of Customer Base with a HS Diploma
Regression Analysis: MonthlySales versus PercentHSGrads
Predictor
Coef SD Coef TP
Constant
|-2970
1371
PercentHSGrads 59.66 17.67
S = 802.004 R-Sq =
%3D
Analysis of Variance
Source
DF
S
MS FP
Regression
7333350
Residual Error
23155564
Total
37
Using the partial R output, answer the questions below.
(a) Estimate the model. Use two-decimals your estimation of the slope term, no decimals in the estimation of the y-intercept.
MonthlySales; :
Percent H SGrads;
+
(b) What percentage of the variation in a store's monthly sales cannot be explained by its linear dependency on the percentage of the customer base that are high school graduates? Enter your answer as a percentage, using two decimal places.
%
Sales in $1000s
Expert Solution
This question has been solved!
Explore an expertly crafted, step-by-step solution for a thorough understanding of key concepts.

This is a popular solution!

Trending now
This is a popular solution!

Step by step
Solved in 2 steps

Knowledge Booster


Learn more about
Need a deep-dive on the concept behind this application? Look no further. Learn more about this topic, statistics and related others by exploring similar questions and additional content below.Recommended textbooks for you
Algebra & Trigonometry with Analytic Geometry
Algebra
ISBN:
9781133382119
Author:
Swokowski
Publisher:
Cengage
Algebra & Trigonometry with Analytic Geometry
Algebra
ISBN:
9781133382119
Author:
Swokowski
Publisher:
Cengage