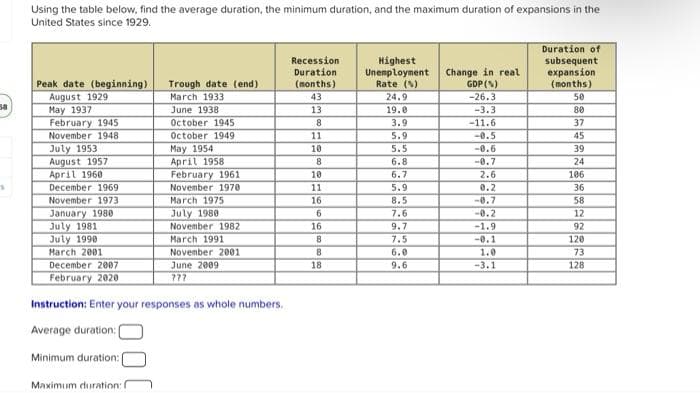
Using the table below, find the average duration, the minimum duration, and the maximum duration of expansions in the United States since 1929. Recession Duration (months) Highest Unemployment Rate () 24.9 Change in real GDP (N) -26.3 Duration of subsequent expansion (months) Peak date (beginning) August 1929 May 1937 February 1945 November 1948 Trough date (end) March 1933 June 1938 43 50 13 19.0 -3.3 80 October 1945 8 3.9 -11.6 37 October 1949 11 5.9 -0.5 45 July 1953 August 1957 April 1960 May 1954 April 1958 February 1961 10 5.5 -0.6 39 8 6.8 -0.7 24 10 6.7 2.6 106 December 1969 November 1970 11 5.9 0.2 36 March 1975 July 1980 November 1982 November 1973 16 8.5 7.6 -0.7 -0.2 58 January 1980 July 1981 July 1990 Harch 2001 12 16 9.7 -1.9 92 120 March 1991 November 2001 June 2009 7.5 -0.1 6.0 1.0 73 December 2007 18 9.6 -3.1 128 February 2020 777 Instruction: Enter your responses as whole numbers. Average duration: Minimum duration: Maximum duration:
Using the table below, find the average duration, the minimum duration, and the maximum duration of expansions in the United States since 1929. Recession Duration (months) Highest Unemployment Rate () 24.9 Change in real GDP (N) -26.3 Duration of subsequent expansion (months) Peak date (beginning) August 1929 May 1937 February 1945 November 1948 Trough date (end) March 1933 June 1938 43 50 13 19.0 -3.3 80 October 1945 8 3.9 -11.6 37 October 1949 11 5.9 -0.5 45 July 1953 August 1957 April 1960 May 1954 April 1958 February 1961 10 5.5 -0.6 39 8 6.8 -0.7 24 10 6.7 2.6 106 December 1969 November 1970 11 5.9 0.2 36 March 1975 July 1980 November 1982 November 1973 16 8.5 7.6 -0.7 -0.2 58 January 1980 July 1981 July 1990 Harch 2001 12 16 9.7 -1.9 92 120 March 1991 November 2001 June 2009 7.5 -0.1 6.0 1.0 73 December 2007 18 9.6 -3.1 128 February 2020 777 Instruction: Enter your responses as whole numbers. Average duration: Minimum duration: Maximum duration:

Chapter14: Macroeconomic Policy: Tradeoffs, Expectations, Credibility, And Sources Of Business Cycles
Section: Chapter Questions
Problem 9E

Related questions
Question
6
Transcribed Image Text:Using the table below, find the average duration, the minimum duration, and the maximum duration of expansions in the
United States since 1929.
Recession
Duration
(months)
Highest
Unemployment
Rate ()
24.9
Change in real
GDP (N)
-26.3
Duration of
subsequent
expansion
(months)
50
Peak date (beginning)
August 1929
May 1937
February 1945
November 1948
Trough date (end)
March 1933
43
June 1938
13
19.0
-3.3
80
October 1945
3.9
-11.6
37
October 1949
11
5.9
-0.5
45
July 1953
August 1957
April 1960
December 1969
November 1973
May 1954
April 1958
February 1961
10
5.5
-0.6
39
8
6.8
-0.7
24
10
6.7
2.6
106
November 1970
11
5.9
0.2
36
March 1975
16
8.5
-0.7
58
July 1980
November 1982
January 1980
July 1981
July 1990
March 2001
7.6
-0.2
12
16
9.7
-1.9
92
March 1991
7.5
120
-0.1
1.0
November 2001
June 2009
6.0
73
December 2007
18
9.6
-3.1
128
February 2020
१??
Instruction: Enter your responses as whole numbers.
Average duration:
Minimum duration:
Maximum duration:
Expert Solution
This question has been solved!
Explore an expertly crafted, step-by-step solution for a thorough understanding of key concepts.

This is a popular solution!

Trending now
This is a popular solution!

Step by step
Solved in 2 steps with 2 images

Knowledge Booster


Learn more about
Need a deep-dive on the concept behind this application? Look no further. Learn more about this topic, economics and related others by exploring similar questions and additional content below.Recommended textbooks for you

Managerial Economics: Applications, Strategies an…
Economics
ISBN:
9781305506381
Author:
James R. McGuigan, R. Charles Moyer, Frederick H.deB. Harris
Publisher:
Cengage Learning
Managerial Economics: Applications, Strategies an…
Economics
ISBN:
9781305506381
Author:
James R. McGuigan, R. Charles Moyer, Frederick H.deB. Harris
Publisher:
Cengage Learning