Using these three plots, determine which type of model would be the best type: Linear exponential. power Circle your answer and give reasons why you chose that answer.
Using these three plots, determine which type of model would be the best type: Linear exponential. power Circle your answer and give reasons why you chose that answer.

Algebra & Trigonometry with Analytic Geometry
13th Edition
ISBN:9781133382119
Author:Swokowski
Publisher:Swokowski
Chapter5: Inverse, Exponential, And Logarithmic Functions
Section: Chapter Questions
Problem 15DE

Related questions
Question
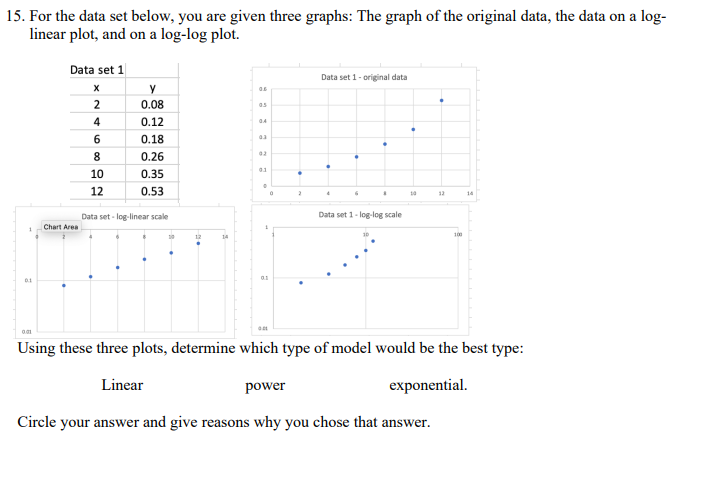
Transcribed Image Text:15. For the data set below, you are given three graphs: The graph of the original data, the data on a log-
linear plot, and on a log-log plot.
0.1
Data set 1
X
2
4
Chart Area
6892
10
12
у
0.08
0.12
0.18
0.26
0.35
0.53
Data set-log-linear scale
0.6
Linear
04
0.1
0
01
0
.
2
Data set 1- original data
.
6
*
Data set 1-log-log scale
.
12
power
Circle your answer and give reasons why you chose that ans
answer.
100
Using these three plots, determine which type of model would be the best type:
exponential.
14
Expert Solution
This question has been solved!
Explore an expertly crafted, step-by-step solution for a thorough understanding of key concepts.

Step by step
Solved in 2 steps

Recommended textbooks for you
Algebra & Trigonometry with Analytic Geometry
Algebra
ISBN:
9781133382119
Author:
Swokowski
Publisher:
Cengage


College Algebra (MindTap Course List)
Algebra
ISBN:
9781305652231
Author:
R. David Gustafson, Jeff Hughes
Publisher:
Cengage Learning
Algebra & Trigonometry with Analytic Geometry
Algebra
ISBN:
9781133382119
Author:
Swokowski
Publisher:
Cengage
College Algebra (MindTap Course List)
Algebra
ISBN:
9781305652231
Author:
R. David Gustafson, Jeff Hughes
Publisher:
Cengage Learning