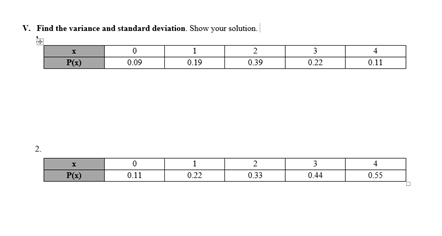
V. Find the variance and standard deviation. Show your solution. 1 0.19 P(x) 0.09 0.39 0.22 0.11


Q: Given X= 4Y + 5 and Y = KX + 4 are the lines of %3D regression of X on Y and Y on X respectively. If...
A: Solution is given in the picture:
Q: Consider The following data in Otacnu Tours Inc., which represents the overall miles per gallon, in ...
A: As per the Bartleby guildlines we have to solve first three subparts and rest can be reposted.... Gi...
Q: The height of a certain type of palm tree is normally distributed with mean 45 feet and standard dev...
A: The height is normally distributed with a mean 45 and a standard deviation of 10.
Q: If the Pearson coefficient of skewness for a data set is 1.945, what can be concluded about the data...
A: GIVEN: Pearson coefficient of skewnes for a data is Sk=1.945 Then data is 1): right skewed 2): l...
Q: 3. The daily salary earned by employed at Mesra Company are as follows: Daily salary (cm) Frequency ...
A: Mean of a frequency distribution is the average value. Histogram is a diagrammatic representation of...
Q: Answer the following multiple choice questions. You must show some relavent work and/or explanation ...
A: In a one-Way ANOVA, error variability is computed as the sum of the squared errors(SSE),for all valu...
Q: For the data set 1 2 3 57 7 8 9 10 12 13 13 14 14 15 16 16 19 19 21 23 23 23 24 26 26 27 27 28 28 31...
A: Given data set 1,2,3,5,7,7,8,9,10,12,13,13,14,14,15,16,16,19,19,21,23,23,23,24,26,26,27,27,28,28,31,...
Q: n=20, a =0.01 -"/2,n – 1
A:
Q: You must estimate the mean temperature (in degrees Fahrenheit) with the following sample temperature...
A:
Q: Given the image below, what can be determined about the z-score associated with the shaded area?
A: We have to identify the z score for given area inder Standard Normal curve.
Q: 87 85 56 75 34 96 54 74 52 65 78 90 93 15 72 45 87 64 34 - 57 65 74 85 64 98 67 81 a. Determine an a...
A: A range is the difference between the maximum value and minimum value of a dataset. It helps us dete...
Q: The prime Minister of a small Caribbean Island stated that 95% of the population was vaccinated from...
A: Given data number of success , x= 240 sample size, n =300 population proportion,p=...
Q: Using the dataset above, fill in the following frequency table. Write your classes in interval notat...
A: Here we have given that the data set 4.0, 3.8, 3.7, 3.6, 3.6, 3.2, 3.1, 3.0, 2.9, 2.8, 2.5, 2.2, 2.1...
Q: Let X1, X2, ., Xn be a random sample from a distribution with mean u and variance o2. Consider the r...
A:
Q: The average return of a risky portfolio is 10.5% per year with a stan- dard deviation of 18%. If ret...
A:
Q: The owner of a chain of fast food restaurants is considering a new computer system for an accounting...
A: With the help of table we have to first found expected time and variance
Q: Find (i) the Mean of X, (ii) Coefficient of correlation between X and Y.
A: here given N= 50 regression equation X on Y is 3Y-5X = -180 variance of X is 9/16 of variance of X ...
Q: The data below represents the monthly share price of Hong Leong Bank Bhd (HLBB) from August 2020 to ...
A: Hey there! Thank you for posting the question. Since your question has more than 3 parts, we are sol...
Q: Suppose we know that the mean score among the population of college students taking the GMAT test is...
A: Here Given Sample size=n=100 Population Mean=1000=μ Population sd=σ=1200 Here SAMPLE SIZE IS GREATE...
Q: A random sample of 50 four-year-old attending day care centres provided a yearly tuition average of ...
A:
Q: Assume that a procedure yields a binomial distribution with a trial repeated n = 5 times. Use some f...
A:
Q: An electronic circuit consists of 5 silicon transistors, 3 silicon diodes, 10 compo- sition resistor...
A:
Q: A manufacturer receives parts from two suppliers. An SRS of 400 parts from supplier 1 finds 20 defec...
A: For the given data Find 95% confidence interval for p1-p2 UCL =?
Q: A binomial experiment has the given number of trials n and the given success probability p. n=10, p=...
A: Given,n=10 , p=0.2q=1-0.2=0.8A random variable X~Binomial(n=10 , p=0.2)P(X=x)=10x0.2x0.810-x ; ...
Q: * Let X,. X2, ..., X, be an independent sam- ple from a normal distribution with unknown mean u and ...
A:
Q: An simple random sample (SRS) of 100 laborers who use the services of a national temporary employmen...
A: In this case, a sample of 100 laborers is selected.
Q: While performing searches on the Internet to find accommodation, Jasmine realized that the cost of a...
A: Given the data of number of Inhabitants and mean monthly rent of a 4 1/2 Room unit is shown below Th...
Q: For a group containing 100 observations, the arithmetic mean and standard deviation are 8 and v10.5....
A: Given that : For Combine group Total sample size(n)=100 Arithmetic mean =8 Standard deviation=√1...
Q: An instructor of mathematics wishes to determine the relationship of grades on a final examination t...
A:
Q: (c) Find the probability that 8 or more of the flights were on time. The probability that 8 or more ...
A: Let p be the probability that a flight is on time. Given that p = 0.85 Let X denote the number of fl...
Q: Determine whether you can use the normal distribution to approximate the binomial distribution. If y...
A:
Q: Two samples of 6 and 5 items respectively gave the following data : Mean of 1st sample 40 Standard d...
A:
Q: You work for the U.S. Food and Drug Administration. You have gotten word that a drug manufacturing i...
A: For the given data ( a )construct a 97% confidence interval b) Is the company putting the claimed 3...
Q: The one-sample t statistic from a sample of n = 19 observations for the two-sided test of Ho : u = 6...
A:
Q: 2. The frequency distribution for the systolic blood pressure readings (mmHg) of 200 randomly select...
A:
Q: Please balance the following Trip Generation results. Zone Productions Attractions 1 75 750 2 225 35...
A:
Q: Here are measurements (in millimeters) of a critical dimension on an SRS of 8 of the more than 200 a...
A: We assume the data is normally distributed.
Q: You measure 35 randomly selected textbooks' weights, and find they have a mean weight of 63 ounces. ...
A:
Q: Assume this is a simple random sample from a population. Use the Empirical Method to estimate the pr...
A: The number of persons have some confidence in education institutions is 17867.
Q: Obtain the normalized histogram of the following 8-bit, M x N image. Express your L histogram either...
A:
Q: (a) (b) State the sequence of steps involved in hypothesis testing and significance. Bus brake pads ...
A:
Q: A poll conducted in 2013 found that 52% of U.S. adult Twitter users get at least some news on Twitte...
A: at first construct the 99% confidence interval.........
Q: A 28th percentile corresponds to O a. an area corresponding to a z score of -o.28 O b. a data value ...
A: Percentile : Percentile is the number such that certain percentage of data fall below that number. ...
Q: (c) Find the probability that all four tires have low air pressure. The probability that all four ti...
A:
Q: 4.32 Weekly CPU time used by an accounting firm has probability density function (measured in hours)...
A:
Q: Using the table above, answer the questions below A) What is P(A'|B)? B) What is P(B|A)? C) What is ...
A: From given table, P(A) = 86/129 P(B) = 75/129 P(A' and B) = 25/129 P(A and B) = 50/129 Note : Accord...
Q: A textile worker in the city of Bombay earns 350 per month. The cost of living for a particular mont...
A:
Q: Below is bivariate data on vintage dresser auctions, where X is the year of construction of the dres...
A: For the given data Find Correlation ,regression line
Q: What is the critical value t* for a 90% confidence interval when n = 15? 1.645 O b 1.960 1.761
A: Given: n = 15 confidence level, c = 90% = 0.90
Q: The plots below were created using the Galton data set from the mosaic package. For each, provide R ...
A: R code Data analysis often involves visualization. Some insights that may not be apparent in numbers...

Step by step
Solved in 2 steps with 1 images
