Valtec Electronics fills orders for its electronic components and parts by truck to customers through several distribution centers. A measure of its supply chain responsiveness is order fulfillment lead time, which is the number of days from when a company receives an order to when it is delivered to the customer. A distribution center manager has taken 20 samples of 5 orders each during the month and recorded the lead time for each as follows: Sample 1 2 3 4 5 6 7 8 9 10 11 12 13 14 15 16 1.3 2.1 4.2 1.6 2.6 0.8 2.6 3.4 3.1 2.4 1.9 6.1 1.2 2.4 3.7 3.6 0.4 17 18 19 2.4 1.2 3.3 2.1 3 2.7 3.5 6.1 1.8 3.6 3 1.5 1.4 1.9 5.8 4.5 3.1 1.4 1.5 2.8 2.5 2.2 1.8 4.8 5.9 4.4 2.7 3.4 0.4 4.9 2.1 5.2 3.4 2.8 4.5 2.9 3.4 2.5 7 1.4 3.3 2.7 4.8 1.7 1.8 6.5 4.8 2.9 3.4 4.4 3.6 2.9 5.2 20 4.7 2 2 1.8 a. Construct an X-chart to be used in conjunction with an R-chart using 30 limits for this data and indicate if the process is in control. b. Please make recommendations about further actions based on results. 5.3 2.7 Load Time Days 0.7 1 2.6 2.8 3 2.5 1.5 0.9 4.6 3.7 3.6 2.5 2.9 3.2 2.2 3.6 2.3 2.3 2.4 2 3.2 4.8 4.1 3.1
Valtec Electronics fills orders for its electronic components and parts by truck to customers through several distribution centers. A measure of its supply chain responsiveness is order fulfillment lead time, which is the number of days from when a company receives an order to when it is delivered to the customer. A distribution center manager has taken 20 samples of 5 orders each during the month and recorded the lead time for each as follows: Sample 1 2 3 4 5 6 7 8 9 10 11 12 13 14 15 16 1.3 2.1 4.2 1.6 2.6 0.8 2.6 3.4 3.1 2.4 1.9 6.1 1.2 2.4 3.7 3.6 0.4 17 18 19 2.4 1.2 3.3 2.1 3 2.7 3.5 6.1 1.8 3.6 3 1.5 1.4 1.9 5.8 4.5 3.1 1.4 1.5 2.8 2.5 2.2 1.8 4.8 5.9 4.4 2.7 3.4 0.4 4.9 2.1 5.2 3.4 2.8 4.5 2.9 3.4 2.5 7 1.4 3.3 2.7 4.8 1.7 1.8 6.5 4.8 2.9 3.4 4.4 3.6 2.9 5.2 20 4.7 2 2 1.8 a. Construct an X-chart to be used in conjunction with an R-chart using 30 limits for this data and indicate if the process is in control. b. Please make recommendations about further actions based on results. 5.3 2.7 Load Time Days 0.7 1 2.6 2.8 3 2.5 1.5 0.9 4.6 3.7 3.6 2.5 2.9 3.2 2.2 3.6 2.3 2.3 2.4 2 3.2 4.8 4.1 3.1

Holt Mcdougal Larson Pre-algebra: Student Edition 2012
1st Edition
ISBN:9780547587776
Author:HOLT MCDOUGAL
Publisher:HOLT MCDOUGAL
Chapter11: Data Analysis And Probability
Section11.4: Collecting Data
Problem 6E

Related questions
Question
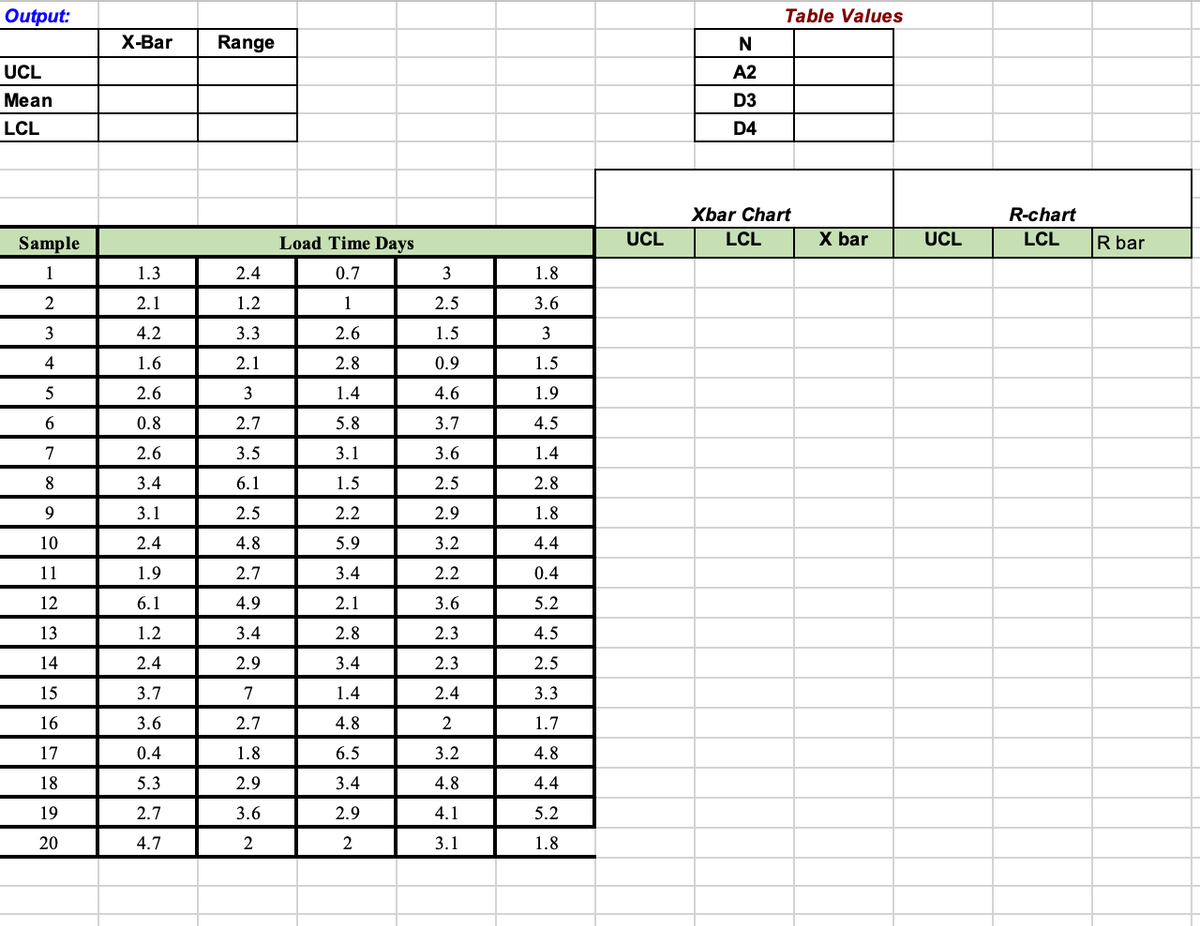
Transcribed Image Text:Output:
UCL
Mean
LCL
Sample
1
2
3
4
5
6
7
8
9
10
11
12
13
14
15
16
17
18
19
20
X-Bar Range
1.3
2.1
4.2
1.6
2.6
0.8
2.6
3.4
3.1
2.4
1.9
6.1
1.2
2.4
3.7
3.6
0.4
5.3
2.7
4.7
2.4
1.2
3.3
2.1
3
2.7
3.5
6.1
2.5
4.8
2.7
4.9
3.4
2.9
7
2.7
1.8
2.9
3.6
2
Load Time Days
0.7
1
2.6
2.8
1.4
5.8
3.1
1.5
2.2
5.9
3.4
2.1
2.8
3.4
1.4
4.8
6.5
3.4
2.9
2
3
2.5
1.5
0.9
4.6
3.7
3.6
2.5
2.9
3.2
2.2
3.6
2.3
2.3
2.4
2
3.2
4.8
4.1
3.1
1.8
3.6
3
1.5
1.9
4.5
1.4
2.8
1.8
4.4
0.4
5.2
4.5
2.5
3.3
1.7
4.8
4.4
5.2
1.8
UCL
N
A2
D3
D4
Table Values
Xbar Chart
LCL
X bar
UCL
R-chart
LCL
R bar
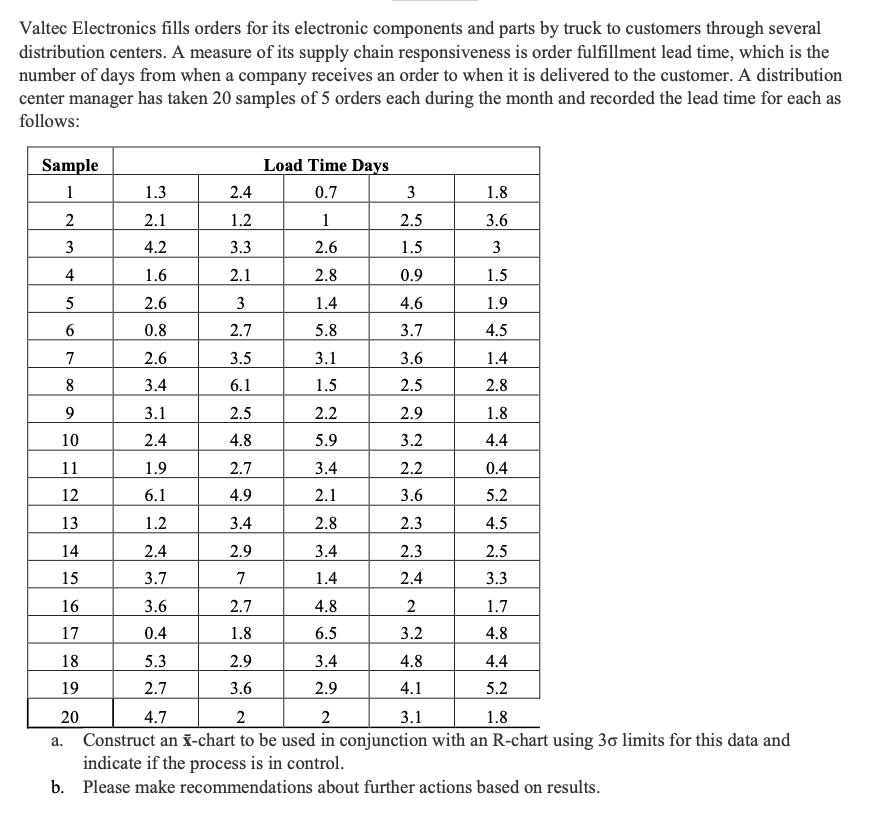
Transcribed Image Text:Valtec Electronics fills orders for its electronic components and parts by truck to customers through several
distribution centers. A measure of its supply chain responsiveness is order fulfillment lead time, which is the
number of days from when a company receives an order to when it is delivered to the customer. A distribution
center manager has taken 20 samples of 5 orders each during the month and recorded the lead time for each as
follows:
Sample
1
2
3
4
5
6
7
8
9
10
11
12
13
14
15
16
17
18
19
20
1.3
2.1
4.2
1.6
2.6
0.8
2.6
3.4
3.1
2.4
1.9
6.1
1.2
2.4
3.7
a.
3.6
0.4
2.4
1.2
3.3
2.1
5.3
2.7
3
2.7
3.5
6.1
2.5
4.8
2.7
4.9
3.4
2.9
7
1.4
2.8
1.8
4.4
0.4
5.2
4.5
2.5
3.3
1.7
4.8
4.4
5.2
4.7
2
2
1.8
Construct an X-chart to be used in conjunction with an R-chart using 30 limits for this data and
indicate if the process is in control.
b. Please make recommendations about further actions based on results.
2.7
1.8
Load Time Days
0.7
2.9
3.6
1
2.6
2.8
1.4
5.8
3.1
1.5
2.2
5.9
3.4
2.1
2.8
3.4
1.4
4.8
6.5
3
2.5
1.5
0.9
4.6
3.7
3.6
2.5
2.9
3.2
2.2
3.6
2.3
2.3
2.4
2
3.2
4.8
4.1
3.1
3.4
2.9
1.8
3.6
3
1.5
1.9
4.5
Expert Solution
This question has been solved!
Explore an expertly crafted, step-by-step solution for a thorough understanding of key concepts.

Step by step
Solved in 2 steps with 4 images

Recommended textbooks for you
Holt Mcdougal Larson Pre-algebra: Student Edition…
Algebra
ISBN:
9780547587776
Author:
HOLT MCDOUGAL
Publisher:
HOLT MCDOUGAL

College Algebra (MindTap Course List)
Algebra
ISBN:
9781305652231
Author:
R. David Gustafson, Jeff Hughes
Publisher:
Cengage Learning

Holt Mcdougal Larson Pre-algebra: Student Edition…
Algebra
ISBN:
9780547587776
Author:
HOLT MCDOUGAL
Publisher:
HOLT MCDOUGAL
College Algebra (MindTap Course List)
Algebra
ISBN:
9781305652231
Author:
R. David Gustafson, Jeff Hughes
Publisher:
Cengage Learning