Variable Parameter Estimates Standard error Constant -164.0 20.24 Price of good X (P.) Price of good Y (P,) -3.50 1.55 2.50 0.28 Per capita Income (/) 0.45 0.52 R-squared Adjusted R-squared 0.8672 0.8132 F-statistic 15.6893 a) Suppose the average price of 3 units of good X is GH¢12, price of 2 units of goodY is GH¢60, the per capita income of Ghana is GH¢420. Write down the estimated demand equation for your firm's product and interpret the parameter estimates. Determine the quantity of good X sold. Estimate the own price elasticity of demand and state the type of demand curve 1. 11. 111. your firm has? What would be the effect of a price increase on the firm's total revenue? iv.
Variable Parameter Estimates Standard error Constant -164.0 20.24 Price of good X (P.) Price of good Y (P,) -3.50 1.55 2.50 0.28 Per capita Income (/) 0.45 0.52 R-squared Adjusted R-squared 0.8672 0.8132 F-statistic 15.6893 a) Suppose the average price of 3 units of good X is GH¢12, price of 2 units of goodY is GH¢60, the per capita income of Ghana is GH¢420. Write down the estimated demand equation for your firm's product and interpret the parameter estimates. Determine the quantity of good X sold. Estimate the own price elasticity of demand and state the type of demand curve 1. 11. 111. your firm has? What would be the effect of a price increase on the firm's total revenue? iv.

Managerial Economics: Applications, Strategies and Tactics (MindTap Course List)
14th Edition
ISBN:9781305506381
Author:James R. McGuigan, R. Charles Moyer, Frederick H.deB. Harris
Publisher:James R. McGuigan, R. Charles Moyer, Frederick H.deB. Harris
Chapter2: Fundamental Economic Concepts
Section: Chapter Questions
Problem 1E: For each of the determinants of demand in Equation 2.1, identify an example illustrating the effect...

Related questions
Question
Qd= 100 - 3P
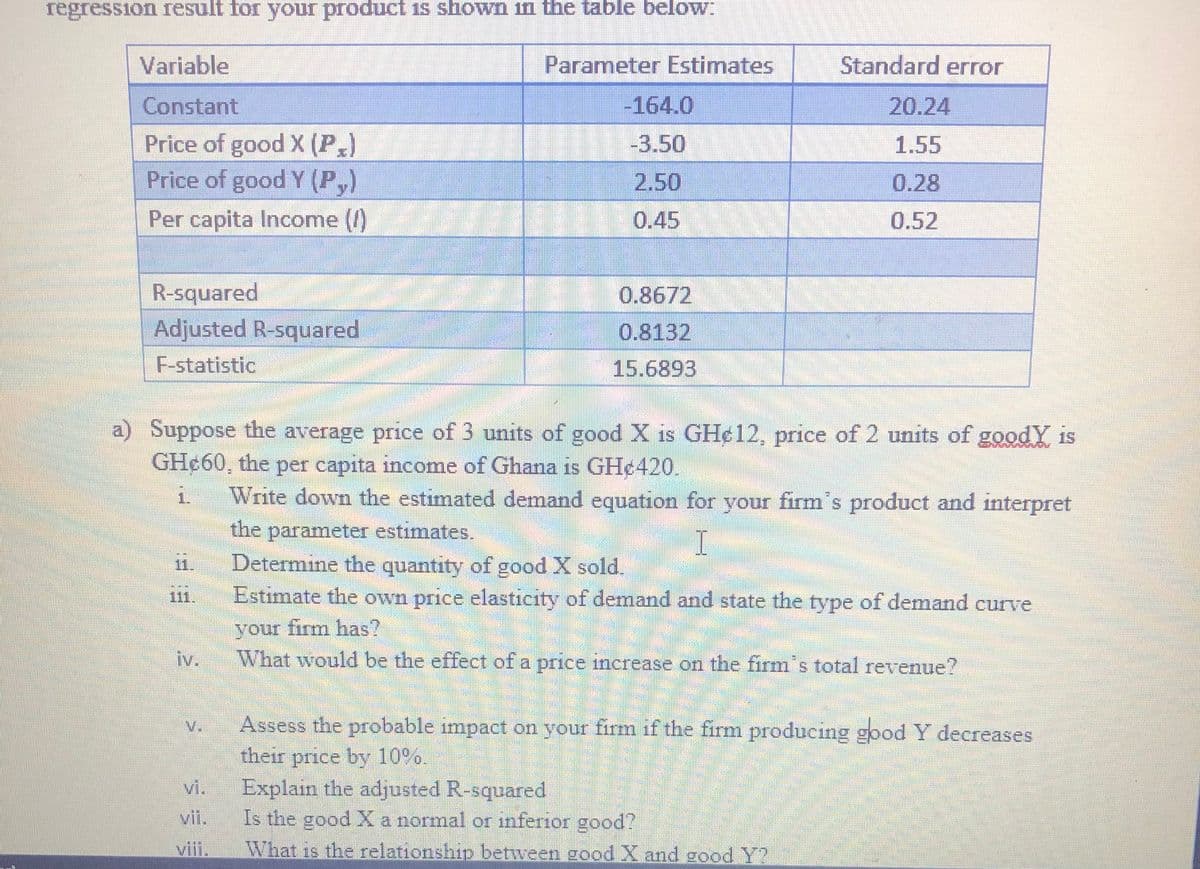
Transcribed Image Text:regression result for your product is shown in the table below:
Variable
Parameter Estimates
Standard error
Constant
-164.0
20.24
Price of good X (P,)
Price of good Y (P,)
-3.50
1.55
2.50
0.28
Per capita Income ()
0.45
0.52
R-squared
Adjusted R-squared
0.8672
0.8132
F-statistic
15.6893
a) Suppose the average price of 3 units of good X is GH¢12, price of 2 units of goodY is
GHe60, the per capita income of Ghana is GH¢420.
Write down the estimated demand equation for your firms product and interpret
the
1.
parameter estimates.
I
11.
Determine the quantity of good X sold.
111.
Estimate the own price elasticity of demand and state the type of demand curve
туре
irm has?
your
What would be the effect of a price iıncrease on the firm's total revenue?
iv.
V.
Assess the probable impact on your firm if the firm producing good Y decreases
their
price by 10%.
Explain the adjusted R-squared
Is the good X a normal or inferior good?
vi.
vii.
viii.
What is the relationship between good X and good Y?
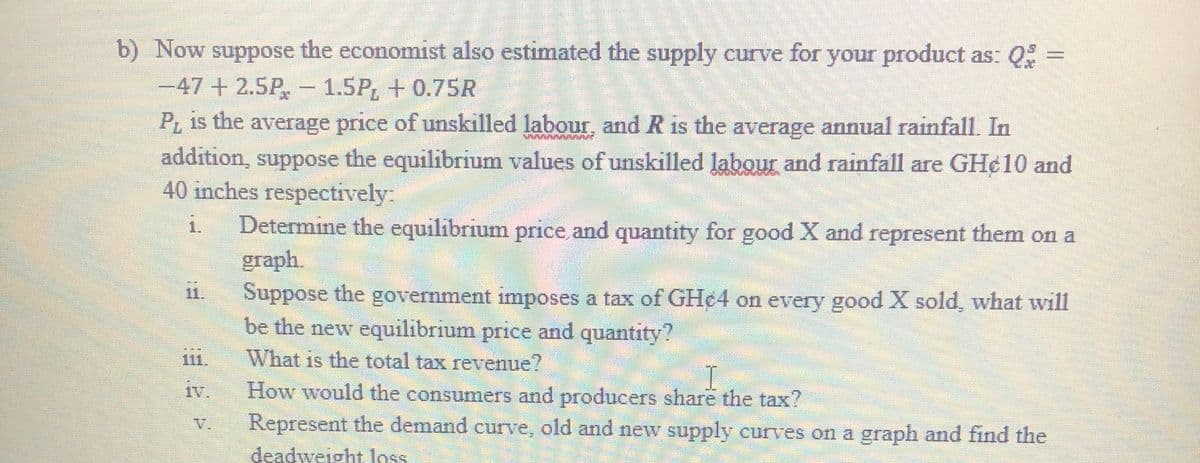
Transcribed Image Text:b) Now suppose the economist also estimated the supply curve for your product as: Q% =
-47+2.5P,- 1.5P, + 0.75R
P is the average price of unskilled labour, and R is the average annual rainfall. In
addition, suppose the equilibrium values of unskilled labour and rainfall are GH¢10 and
40 inches respectively
Determine the equilibrium price and quantity for good X and represent them on a
graph.
Suppose the government imposes a tax of GH¢4 on every good X sold, what will
be the new equilibrium price and quantity?
1.
111.
What is the total tax revenue?
1V.
How would the consumers and producers share the tax?
Represent the demand curve, old and new supply curves on a graph and find the
deadweight loss
V.
Expert Solution
This question has been solved!
Explore an expertly crafted, step-by-step solution for a thorough understanding of key concepts.

Step by step
Solved in 5 steps with 1 images

Knowledge Booster


Learn more about
Need a deep-dive on the concept behind this application? Look no further. Learn more about this topic, economics and related others by exploring similar questions and additional content below.Recommended textbooks for you
Managerial Economics: Applications, Strategies an…
Economics
ISBN:
9781305506381
Author:
James R. McGuigan, R. Charles Moyer, Frederick H.deB. Harris
Publisher:
Cengage Learning

Managerial Economics: Applications, Strategies an…
Economics
ISBN:
9781305506381
Author:
James R. McGuigan, R. Charles Moyer, Frederick H.deB. Harris
Publisher:
Cengage Learning