ving whether wealthier people are happier. ir incomes and their overall happiness lev results, you find that the correlation coeffi = data, respond to the following:
ving whether wealthier people are happier. ir incomes and their overall happiness lev results, you find that the correlation coeffi = data, respond to the following:

Glencoe Algebra 1, Student Edition, 9780079039897, 0079039898, 2018
18th Edition
ISBN:9780079039897
Author:Carter
Publisher:Carter
Chapter4: Equations Of Linear Functions
Section4.5: Correlation And Causation
Problem 2CYU

Related questions
Question
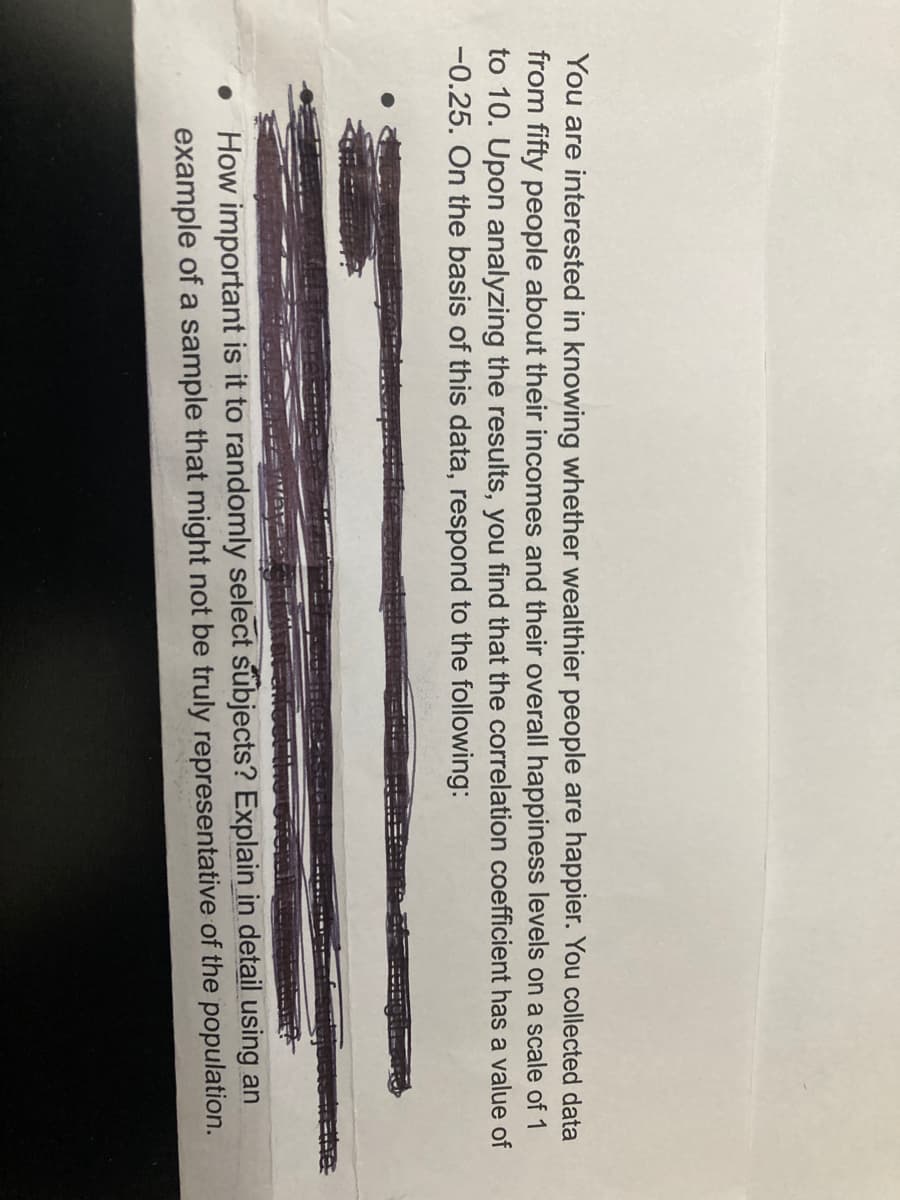
Transcribed Image Text:You are interested in knowing whether wealthier people are happier. You collected data
from fifty people about their incomes and their overall happiness levels on a scale of 1
to 10. Upon analyzing the results, you find that the correlation coefficient has a value of
-0.25. On the basis of this data, respond to the following:
How important is it to randomly select subjects? Explain in detail using an
example of a sample that might not be truly representative of the population.
Expert Solution
This question has been solved!
Explore an expertly crafted, step-by-step solution for a thorough understanding of key concepts.

Step by step
Solved in 3 steps

Recommended textbooks for you
Glencoe Algebra 1, Student Edition, 9780079039897…
Algebra
ISBN:
9780079039897
Author:
Carter
Publisher:
McGraw Hill

Glencoe Algebra 1, Student Edition, 9780079039897…
Algebra
ISBN:
9780079039897
Author:
Carter
Publisher:
McGraw Hill