Vital Statistics: Heights of Men The heights of 18-year-old men are approximately normally distributed, with mean 68 inches and standard a ation 3 inches (based on information from Statistical Abstract of the Uni States, 112th edition). (a) What is the probability that an 18-year-old man selected at random is between 67 and 69 inches tall? (b) If a random sample of nine 18-year-old men is selected, what is the probability that the mean height x is between 67 and 69 inches?
Vital Statistics: Heights of Men The heights of 18-year-old men are approximately normally distributed, with mean 68 inches and standard a ation 3 inches (based on information from Statistical Abstract of the Uni States, 112th edition). (a) What is the probability that an 18-year-old man selected at random is between 67 and 69 inches tall? (b) If a random sample of nine 18-year-old men is selected, what is the probability that the mean height x is between 67 and 69 inches?

College Algebra
7th Edition
ISBN:9781305115545
Author:James Stewart, Lothar Redlin, Saleem Watson
Publisher:James Stewart, Lothar Redlin, Saleem Watson
Chapter9: Counting And Probability
Section9.3: Binomial Probability
Problem 33E: Sick leave probability that a given worker at Dyno Nutrition Will call in sick on a Monday is 004....

Related questions

Topic Video
Question
Transcribed Image Text:suspect that the loader fnaU Siippct
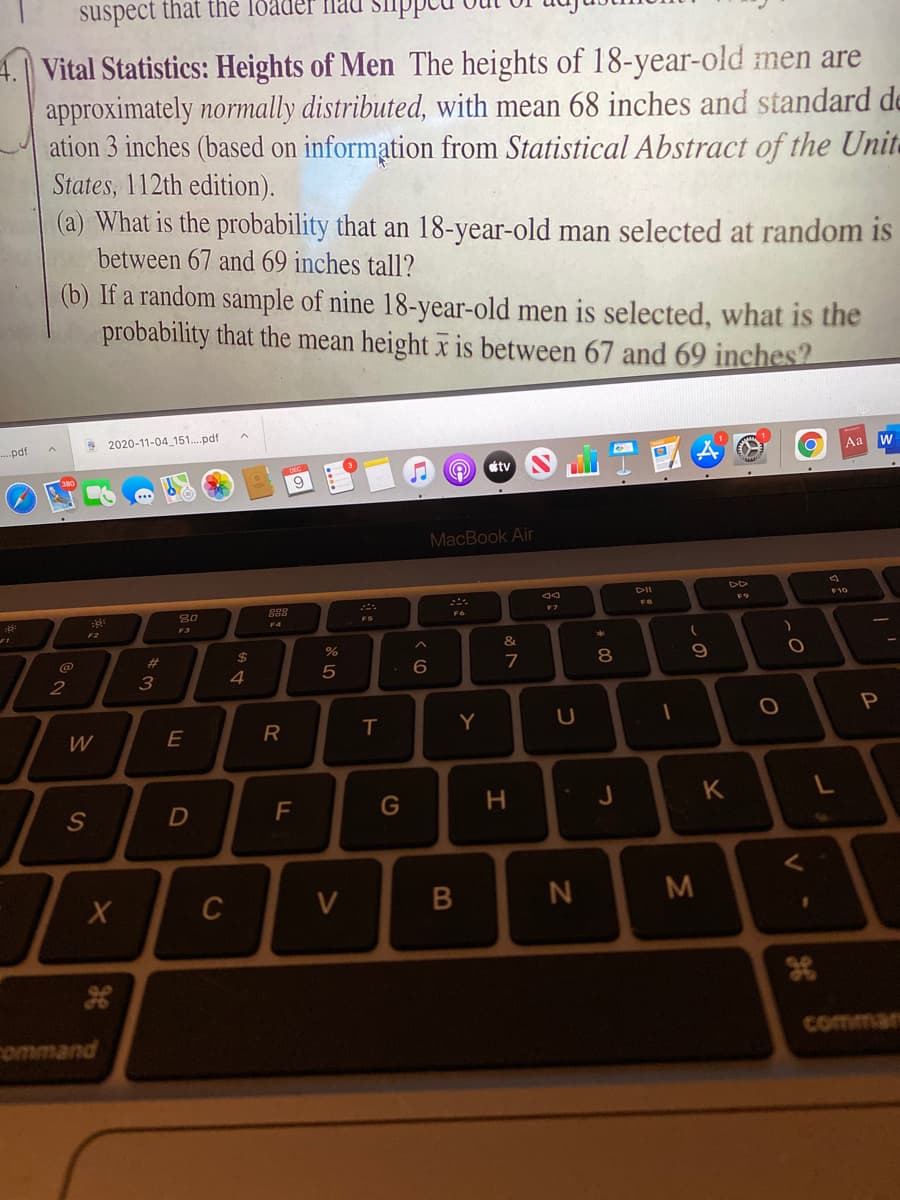
4.| Vital Statistics: Heights of Men The heights of 18-year-old men are
approximately normally distributed, with mean 68 inches and standard de
ation 3 inches (based on information from Statistical Abstract of the Unit-
States, 112th edition).
(a) What is the probability that an 18-year-old man selected at random is
between 67 and 69 inches tall?
(b) If a random sample of nine 18-year-old men is selected, what is the
probability that the mean height x is between 67 and 69 inches?
S 2020-11-04 151.pdf
..pdf
Aa w
tv
9
MacBook Air
DII
F10
80
F7
F6
FS
F4
F2
F3
@
%23
24
9
7
2
3
4
R
Y
W
F
G
J
K
C
V
N
M
ommand
comman
* C0
I
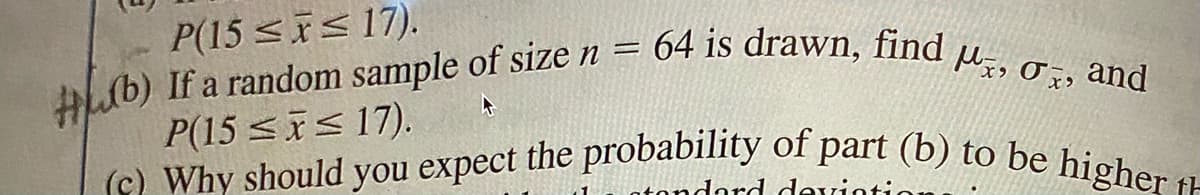
Transcribed Image Text:(c) Why should you expect the probability of part (b) to be higher t
HLub) If a random sample of size n = 64 is drawn, find u, 0z, and
P(15 <is 17).
lb) If a random sample of size n =
P(15 <is 17).
atondard devint
Expert Solution
This question has been solved!
Explore an expertly crafted, step-by-step solution for a thorough understanding of key concepts.

This is a popular solution!

Trending now
This is a popular solution!

Step by step
Solved in 3 steps with 2 images

Knowledge Booster


Learn more about
Need a deep-dive on the concept behind this application? Look no further. Learn more about this topic, statistics and related others by exploring similar questions and additional content below.Recommended textbooks for you
College Algebra
Algebra
ISBN:
9781305115545
Author:
James Stewart, Lothar Redlin, Saleem Watson
Publisher:
Cengage Learning


College Algebra
Algebra
ISBN:
9781305115545
Author:
James Stewart, Lothar Redlin, Saleem Watson
Publisher:
Cengage Learning