Male Female O The data represent the number of driving fatalities for a certain area by age for male and female drivers. under 16 16-20 21-34 35-54 151 126 6719 12.497 12.432 4589 4773 70 and over 2971 2411 4855 55-69 1821 1256 (a) What is the probability that a randomly selected driver fatality who was female was 21 to 34 years old? The probability that a randomly selected driver fatality who was female was 21 to 34 years old is approximately (Round to three decimal places as needed.) (b) That is the probability that a randomly selected driver fatality who was 21 to 34 was female? The probability that a randomly selected driver fatality who was 21 to 34 was female is approximately. (Round to three decimal places as needed.)
Male Female O The data represent the number of driving fatalities for a certain area by age for male and female drivers. under 16 16-20 21-34 35-54 151 126 6719 12.497 12.432 4589 4773 70 and over 2971 2411 4855 55-69 1821 1256 (a) What is the probability that a randomly selected driver fatality who was female was 21 to 34 years old? The probability that a randomly selected driver fatality who was female was 21 to 34 years old is approximately (Round to three decimal places as needed.) (b) That is the probability that a randomly selected driver fatality who was 21 to 34 was female? The probability that a randomly selected driver fatality who was 21 to 34 was female is approximately. (Round to three decimal places as needed.)

Functions and Change: A Modeling Approach to College Algebra (MindTap Course List)
6th Edition
ISBN:9781337111348
Author:Bruce Crauder, Benny Evans, Alan Noell
Publisher:Bruce Crauder, Benny Evans, Alan Noell
Chapter5: A Survey Of Other Common Functions
Section5.6: Higher-degree Polynomials And Rational Functions
Problem 5E: Population Genetics In the study of population genetics, an important measure of inbreeding is the...

Related questions

Question
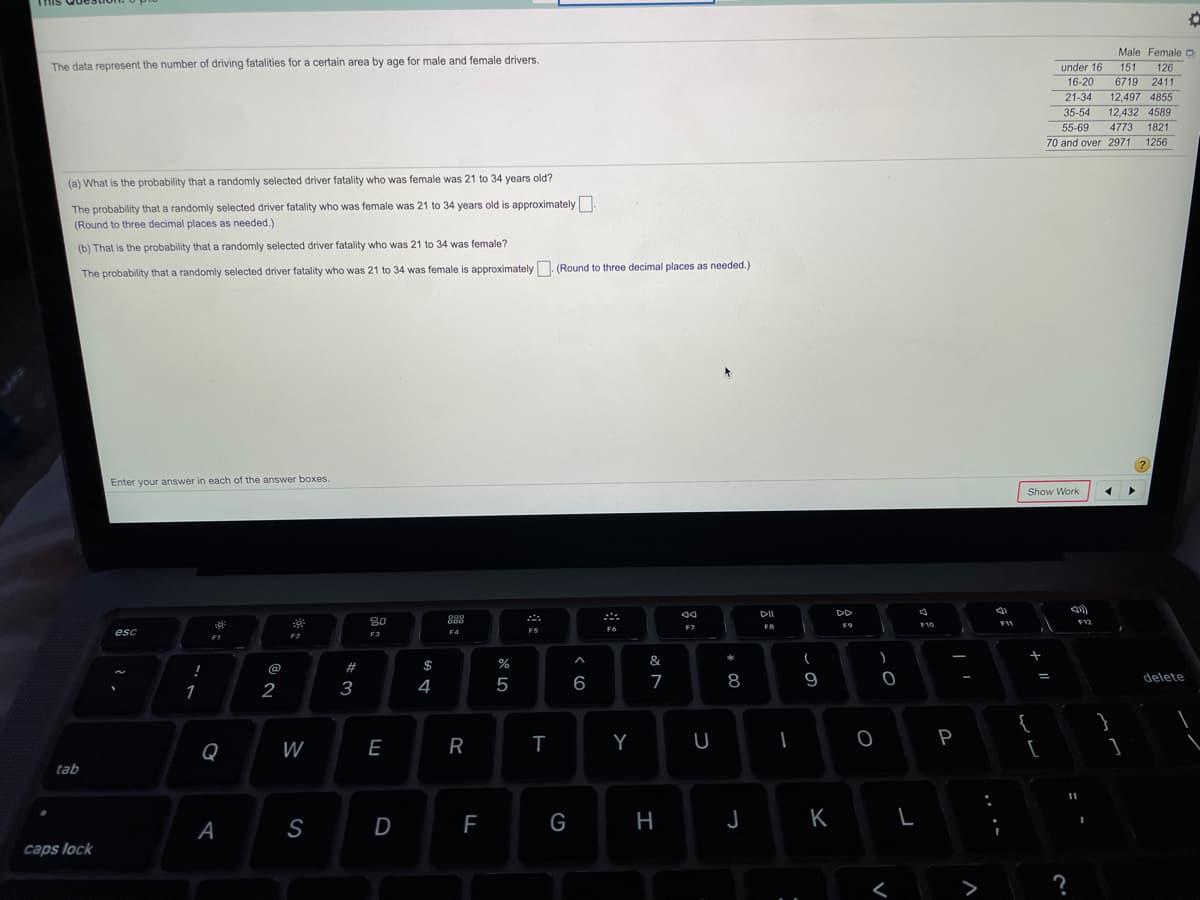
Transcribed Image Text:Male Female O
The data represent the number of driving fatalities for a certain area by age for male and female drivers.
under 16
16-20
21-34
151
126
6719
2411
12,497 4855
35-54
12,432 4589
55-69
4773
1821
70 and over 2971
1256
(a) What is the probability that a randomly selected driver fatality who was female was 21 to 34 years old?
The probability that a randomly selected driver fatality who was female was 21 to 34 years old is approximately
(Round to three decimal places as needed.)
(b) That is the probability that a randomly selected driver fatality who was 21 to 34 was female?
The probability that a randomly selected driver fatality who was 21 to 34 was female is approximately. (Round to three decimal places as needed.)
Enter your answer in each of the answer boxes.
Show Work
DII
DD
80
p00
000
F9
F10
F11
F12
F6
F7
esc
F5
E4
F2
F3
&
!
@
%23
$
2
3
4
5
7
8
9
delete
1
{
}
Q
W
E
R
Y
P
tab
K
A
S
D
caps lock
I
Expert Solution
This question has been solved!
Explore an expertly crafted, step-by-step solution for a thorough understanding of key concepts.

This is a popular solution!

Trending now
This is a popular solution!

Step by step
Solved in 2 steps with 2 images

Knowledge Booster


Learn more about
Need a deep-dive on the concept behind this application? Look no further. Learn more about this topic, statistics and related others by exploring similar questions and additional content below.Recommended textbooks for you
Functions and Change: A Modeling Approach to Coll…
Algebra
ISBN:
9781337111348
Author:
Bruce Crauder, Benny Evans, Alan Noell
Publisher:
Cengage Learning
Functions and Change: A Modeling Approach to Coll…
Algebra
ISBN:
9781337111348
Author:
Bruce Crauder, Benny Evans, Alan Noell
Publisher:
Cengage Learning