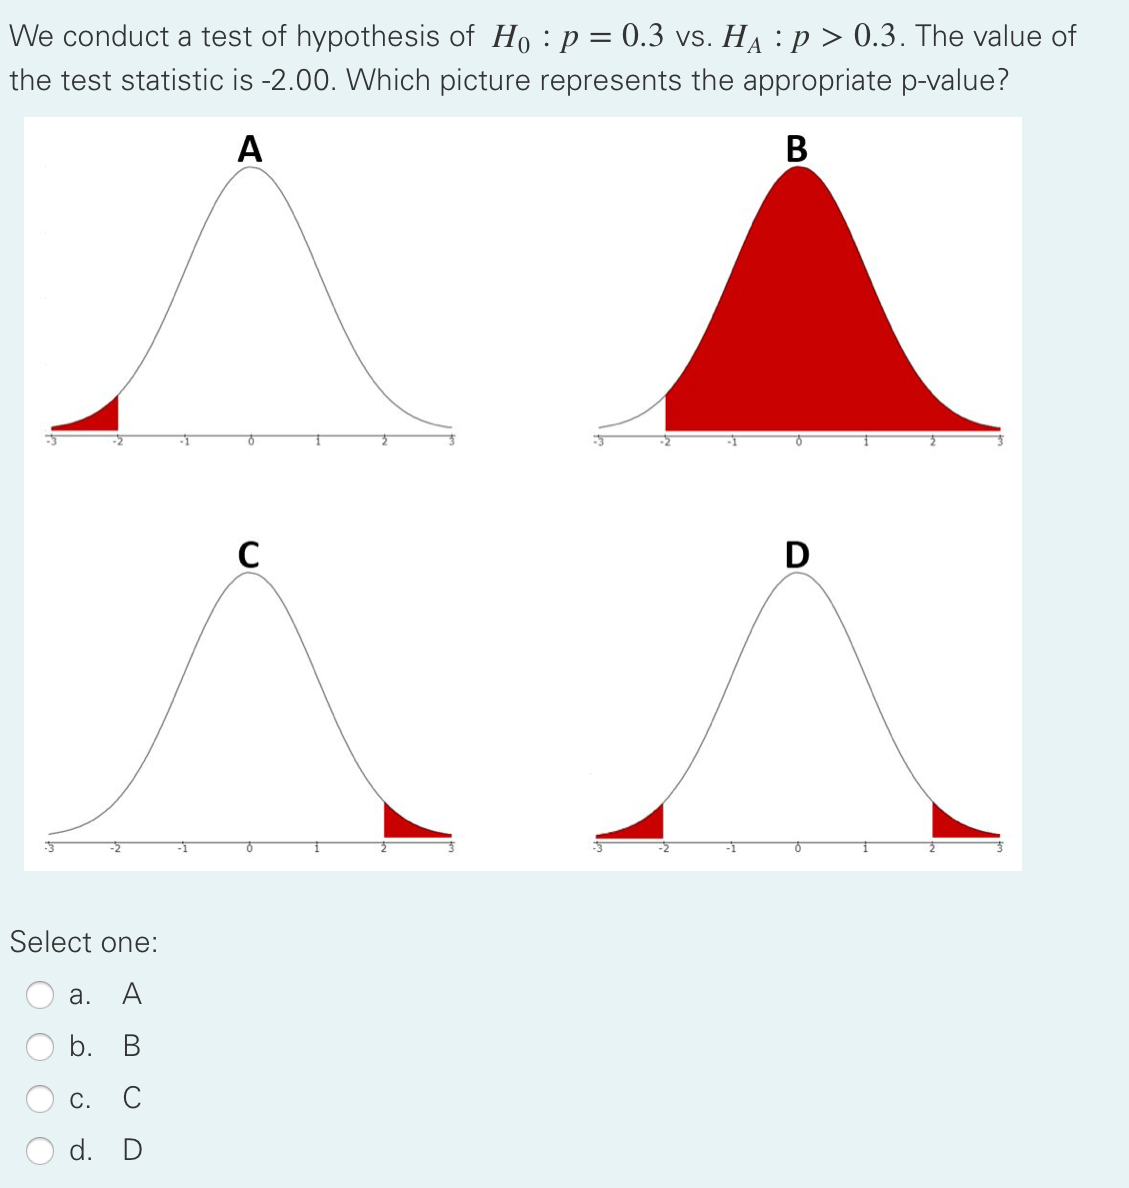
We conduct a test of hypothesis of Ho : p = 0.3 vs. HA : p > 0.3. The value the test statistic is -2.00. Which picture represents the appropriate p-value?


Q: 6. Suppose you are testing Ho: p= 0.8 H1 : p < 0.8, versus where n = 25. From your data, you…
A: Given n = 25 z = 1.2
Q: Suppose that 550 out of 1000 people polled believe that this country needs immigration reform. Is…
A:
Q: (b) The proportion of adults living in a small town who are college graduates is estimated to = 0.6.…
A:
Q: Is achieving a basic skill level related to the location of the school? The results of a random…
A: Given Information : The results of a random sample of students by the location of school and the…
Q: are trying to determine whether the proportion of adult males who smoke is less than 20%. After…
A: Hypothesis testing Hypothesis testing is conducted for the parameters of the population like…
Q: eshman tend to drop Statistics courses during the first week of the semester because the course…
A: Given:p0=0.3x=21n=50 The sample proportion is calculated as:p hat=x/n=21/50=0.42 The null and…
Q: Only about 17% of all people can wiggle their ears. Is this percent higher for millionaires? Of the…
A:
Q: The personality trait of "Conscientiousness" (someone who is organized, responsible, and can control…
A: Here test is two tailed test. And we know population standard deviation so we have to use z test.
Q: Past studies have indicated that the percentage of smokers was estimated to be about 34%. Given the…
A:
Q: Find the value of the standard score, z, and determine whether to reject the null hypothesis at a…
A: Given: Population standard deviation σ=1.3 Sample mean x¯=17.9 Sample size (n) = 100 Hypothesized…
Q: 20% of all college students volunteer their time. Is the percentage of college students who are…
A: We want to find null hypothesis, alternate hypothesis and test statistics Note: According to…
Q: Based on this information, which one of the following statements is correct? If a…
A: We have given that Claim: The true population proportion of adults who favour the colour purple is…
Q: Is there an association between whether adults eat breakfast and whether they own a pet? To…
A: To find: If there is an association between whether adults eat breakfast and whether they own a pet
Q: Only about 14% of all people can wiggle their ears. Is this percent different for millionaires? Of…
A:
Q: If we test the hypotheses below with 0.05 level of significance and n=10, s²=6 Ho: o2-5 HA : 02>5…
A: The following is the formula to calculate the test statistic for population variance has a…
Q: f. Interpret the p-value, according to its definition. (You are not asked to make a decision…
A: Given N=600 Mean=52.38 Standard Deviation=9.726 Standard Error (mean)=0.397 t=6.006 df=599…
Q: A suggestion is made that the proportion of people who have food allergies and/or sensitivities is…
A:
Q: Only about 11% of all people can wiggle their ears. Is this percent different for millionaires? Of…
A: As per our guidelines we are supposed to answer only 3 sub-parts of any one question so I am solving…
Q: 18% of all college students volunteer their time. Is the percentage of college students who are…
A: The sample size is 313 in which 47 of them volunteered their time.
Q: Construct the null and alternative hypothesis a. Investigate whether there is evidence to indicate…
A:
Q: For a hypothesis test of Ho :H = 70 versus HA:µ < 70: • The given sample has a test statistic of…
A: We have the values, Xbar = 67.1 and ? = 18.3 And n = 36 . We have to find p-value ?
Q: Given H₁: Mean waiting time is less than 5 hours. Which of the following best 1 describes the…
A:
Q: What is the level of measurement for the dependent variable? Are the samples dependent (matched) or…
A: Each hypothesis test has two statements, they are null and alternate hypothesis. Null hypothesis is…
Q: A manufacturer of potato chips would like to know whether its bag filling mac underfilling the bags.…
A: we are given that mean = 414gms variance = 169 n = 50 we need to test if the machine is…
Q: Only about 20% of all people can wiggle their ears. Is this percent lower for millionaires? Of the…
A: Given data: Significance level = 0.01 Rejection rule:
Q: 20% of all college students volunteer their time. Is the percentage of college students who are…
A: Given data number of success , x= 49.0 sample size, n = 352 population…
Q: A researcher has participants expecting to receive either painful or mild electrical shocks during a…
A: In survival analysis studies both parametric and non-parametric statistics are used. For example, in…
Q: Find the value of the standard score, z, and determine whether to reject the null hypothesis at a…
A:
Q: Find the value of the standard score, z, and determine whether to reject the null hypothesis at a…
A:
Q: 19% of all college students volunteer their time. Is the percentage of college students who are…
A: From the provided information, Population proportion p = 0.19 Sample size (n) = 389 Out of which 51…
Q: The chi-square statistic for this table is 28.8. Can you reject the null hypothesis? Why or why not?
A: Given Chi-square test statistic is 28.8
Q: Marco conducts a hypothesis test and calculates that his sample results have a p-value of .052, what…
A: Let us assume that level of significance, α=0.05 Given, p-value =0.052
Q: Two possible p-values are given. Which one provides the strongest evidence agains
A: Decision Rule for evidence against H0: If the p value is less than the level of significance, α,…
Q: About 778000 male and 886000 female high school students took the SAT in 2012. We want to decide…
A: Solution : Let, N : Population size n : Sample size m : Men f : Women Nm =…
Q: a. For this study, we should use Select an answer b. The null and alternative hypotheses would be:…
A: “Since you have posted a question with multiple sub-parts, we will solve first three subparts for…
Q: a. For this study, we should use Select an answer b. The null and alternative hypotheses would be:…
A: given: mean = 34 mean of the sample = ∑xn = 31.4 to find: i) type of test ii) null and alternate…
Q: Only about 15% of all people can wiggle their ears. Is this percent higher for millionaires? Of the…
A: Given data: p = 15 % = 0.15 n = 352 x = 60 Significance level = 0.05
Q: State the null and alternative hypotheses for the situation described below for a statistical test.…
A: Different null and alternative hypotheses can be defined as given below Two tailed test: Left tail…
Q: A one- sample t test is used with a sample of 60 scores. The degrees of freedom for this t score are…
A: According to the provided data, a one-sample t-test is used. The sample size, n is provided as 60.
Q: The mean height of a certain kind of plant is 170 centimeters. Suppose we want to carry out a…
A: Given, Mean height of a certain kind of plant (μ) =170 cm
Q: An article published in the Washington Post claims that 45 percent of all Americans have brown eyes.…
A:
Q: Find the P-value for the indicated hypothesis test. In a sample of 47 adults selected randomly from…
A:
Q: Test the claim about the population mean, p, at the given level of significance using the given…
A: The level of significance is 0.04.
Q: a. For this study, we should use Select an answer b. The null and alternative hypotheses would be:…
A: It is given that Sample size n = 68 Sample mean M = 246 Sample SD s = 30.5 Level of significance =…
Q: A test of Ho: μ=0 versus H₁: >0 is performed using a significance level of a=0.05. The P-value is…
A:
Q: 50% of students entering four-year colleges receive a degree within six years. Is this percent…
A:
Q: A researcher wants to determine whether the time spent online per day is related to gender. A random…
A: It is needed to check, whether there is any relationship between the time spent online per day and…
Q: c. What is the p-value associated with the hypothesis test? O p-value = 0.0813 O p-value = 0.1283 O…
A: For the provided information, we need to find the value of p-value associated with the hypothesis…
Q: a. Is there evidence to support the claim that working hours of the PhD student exceeds 13 hours?…
A: Note:**As per guidelines, we can answer only one question. I request you to repost other parts…
Q: Using the proper symbols, write the null and alternative hypotheses for each scenario below. a) A…
A: a. It is given that, p=44%=0.44. It is tested whether the new drug is more effective than aspirin.…


Trending now
This is a popular solution!

Step by step
Solved in 2 steps
