a. For this study, we should use Select an answer b. The null and alternative hypotheses would be: Ho: ?v Select an answerv H1: Select an answerv c. The test statistic ?v= (please show your answer to 3 decimal places.)
a. For this study, we should use Select an answer b. The null and alternative hypotheses would be: Ho: ?v Select an answerv H1: Select an answerv c. The test statistic ?v= (please show your answer to 3 decimal places.)

Glencoe Algebra 1, Student Edition, 9780079039897, 0079039898, 2018
18th Edition
ISBN:9780079039897
Author:Carter
Publisher:Carter
Chapter10: Statistics
Section10.5: Comparing Sets Of Data
Problem 26PFA

Related questions

Topic Video
Question
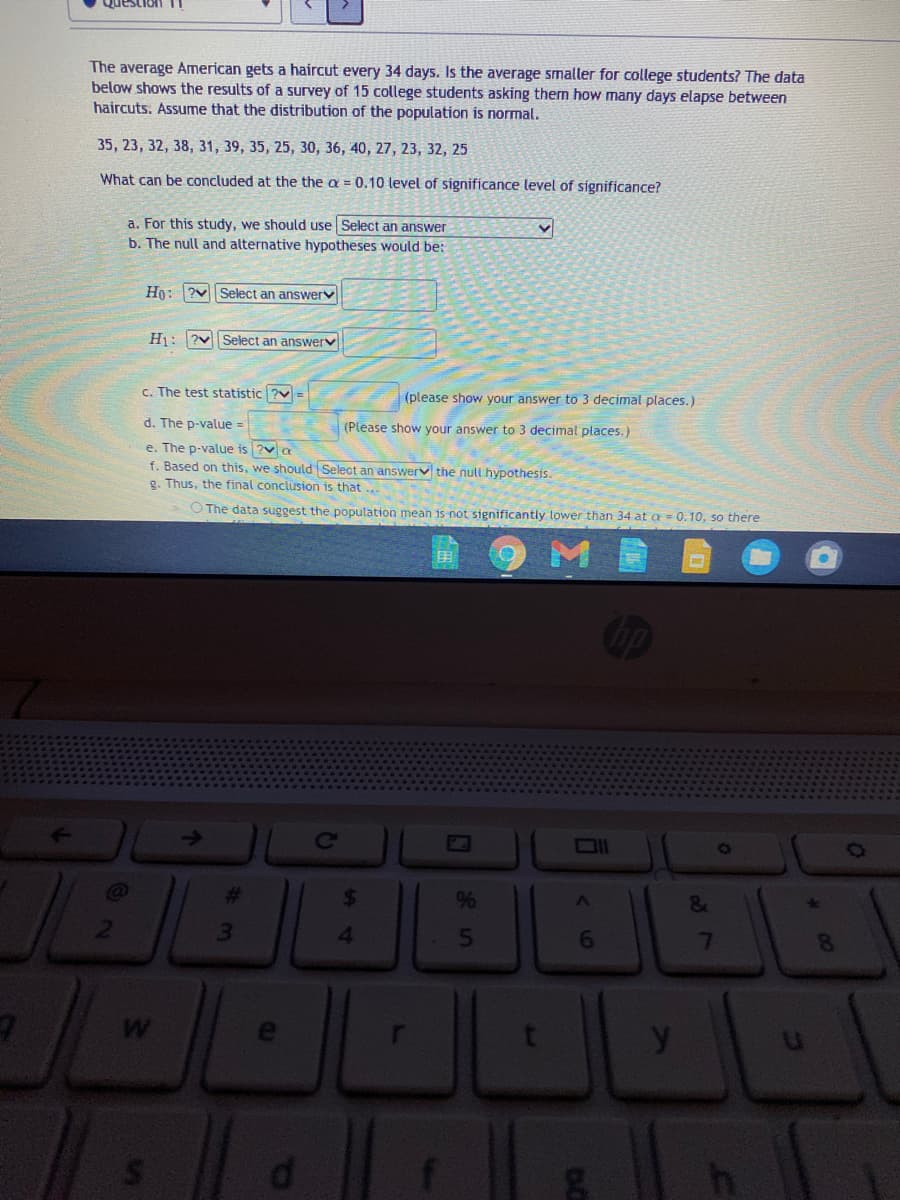
Transcribed Image Text:The average American gets a haircut every 34 days. Is the average smaller for college students? The data
below shows the results of a survey of 15 college students asking them how many days elapse between
haircuts. Assume that the distribution of the population is normal.
35, 23, 32, 38, 31, 39, 35, 25, 30, 36, 40, 27, 23, 32, 25
What can be concluded at the the a = 0.10 level of significance level of significance?
a. For this study, we should use Select an answer
b. The null and alternative hypotheses would be:
Ho: ?v
Select an answerv
Hi: ?vSelect an answerv
c. The test statistic ?v =
(please show your answer to 3 decimal places.)
d. The p-value =
(Please show your answer to 3 decimal places.)
e. The p-value is 2v a
f. Based on this, we should Select an answerv the null hypothesis.
g. Thus, the final conclusion is that..
O The data suggest the population mean is not significantly lower than 34 at a = 0.10, so there
M
24
3.
4.
5
6.
7
EU
Expert Solution
This question has been solved!
Explore an expertly crafted, step-by-step solution for a thorough understanding of key concepts.

Step by step
Solved in 2 steps

Knowledge Booster


Learn more about
Need a deep-dive on the concept behind this application? Look no further. Learn more about this topic, statistics and related others by exploring similar questions and additional content below.Recommended textbooks for you
Glencoe Algebra 1, Student Edition, 9780079039897…
Algebra
ISBN:
9780079039897
Author:
Carter
Publisher:
McGraw Hill
Glencoe Algebra 1, Student Edition, 9780079039897…
Algebra
ISBN:
9780079039897
Author:
Carter
Publisher:
McGraw Hill