We considered the differences between the temperature readings in January 1 of 1968 and 2008 at 51 locations in the continental US in Exercise 5.19. The mean and standard deviation of the reported differences are 1.1 degrees and 4.9 degrees respectively. (a) Calculate a 90% confidence interval for the average difference between the temperature measurements between 1968 and 2008. lower bound: degrees(please round to two decimal places) upper bound: X degrees(please round to two decimal places) (b) Interpret this interval in context. OWe are 90% confident that the mean difference in these sample temperatures is contained between the lower bound and upper bound O There is a 905% chance that the difference in temperatures in a city from year to year will be between the lower bound and upper bound We are 90% confident that 90% of the time the differences in temperatures from year to year will be between the lower bound and upper bound OWe are 90% confident that the true mean difference in temperatures is contained between the lower bound and upper bound
We considered the differences between the temperature readings in January 1 of 1968 and 2008 at 51 locations in the continental US in Exercise 5.19. The mean and standard deviation of the reported differences are 1.1 degrees and 4.9 degrees respectively. (a) Calculate a 90% confidence interval for the average difference between the temperature measurements between 1968 and 2008. lower bound: degrees(please round to two decimal places) upper bound: X degrees(please round to two decimal places) (b) Interpret this interval in context. OWe are 90% confident that the mean difference in these sample temperatures is contained between the lower bound and upper bound O There is a 905% chance that the difference in temperatures in a city from year to year will be between the lower bound and upper bound We are 90% confident that 90% of the time the differences in temperatures from year to year will be between the lower bound and upper bound OWe are 90% confident that the true mean difference in temperatures is contained between the lower bound and upper bound

MATLAB: An Introduction with Applications
6th Edition
ISBN:9781119256830
Author:Amos Gilat
Publisher:Amos Gilat
Chapter1: Starting With Matlab
Section: Chapter Questions
Problem 1P

Related questions
Topic Video
Question
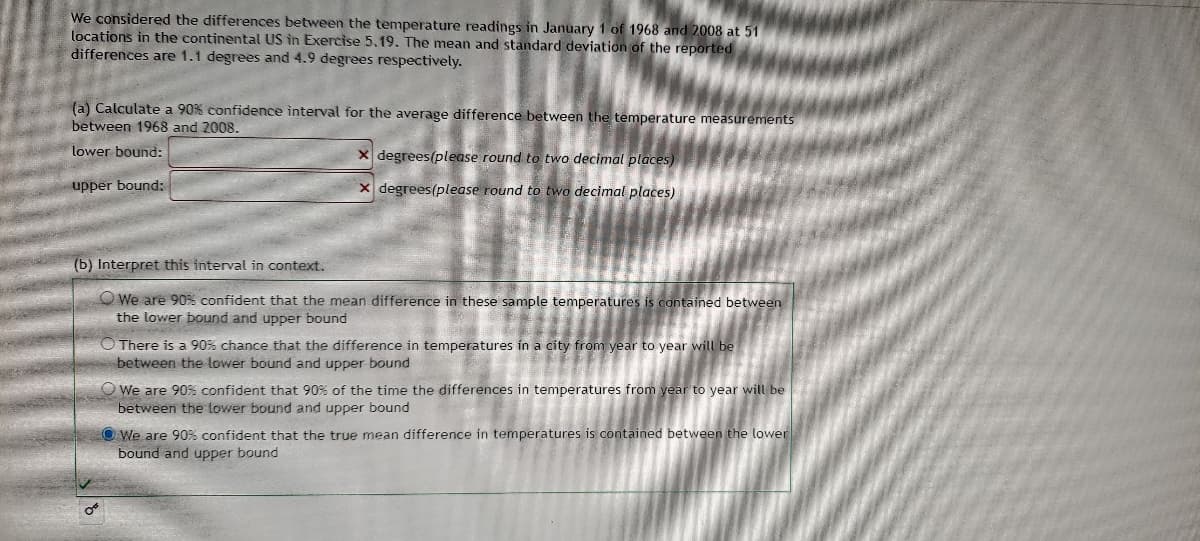
Transcribed Image Text:We considered the differences between the temperature readings in January 1 of 1968 and 2008 at 51
locations in the continental US in Exercise 5,19. The mean and standard deviation of the reported
differences are 1.1 degrees and 4.9 degrees respectively.
(a) Calculate a 90% confidence interval for the average difference between the temperature measurements
between 1968 and 2008.
lower bound:
x degrees(please round to two decimal places)
upper bound:
X degrees(please round to two decimal places)
(b) Interpret this interval in context.
O We are 90% confident that the mean difference in these sample temperatures is contained between
the lower bound and upper bound
O There is a 90% chance that the difference in temperatures in a city from year to year will be
between the lower bound and upper bound
O We are 90% confident that 90% of the time the differences in temperatures from year to year will be
between the lower bound and upper bound
O We are 90% confident that the true mean difference in temperatures is contained between the lower
bound and upper bound
Expert Solution
This question has been solved!
Explore an expertly crafted, step-by-step solution for a thorough understanding of key concepts.

This is a popular solution!

Trending now
This is a popular solution!

Step by step
Solved in 3 steps with 1 images

Knowledge Booster


Learn more about
Need a deep-dive on the concept behind this application? Look no further. Learn more about this topic, statistics and related others by exploring similar questions and additional content below.Recommended textbooks for you
MATLAB: An Introduction with Applications
Statistics
ISBN:
9781119256830
Author:
Amos Gilat
Publisher:
John Wiley & Sons Inc

Probability and Statistics for Engineering and th…
Statistics
ISBN:
9781305251809
Author:
Jay L. Devore
Publisher:
Cengage Learning

Statistics for The Behavioral Sciences (MindTap C…
Statistics
ISBN:
9781305504912
Author:
Frederick J Gravetter, Larry B. Wallnau
Publisher:
Cengage Learning
MATLAB: An Introduction with Applications
Statistics
ISBN:
9781119256830
Author:
Amos Gilat
Publisher:
John Wiley & Sons Inc
Probability and Statistics for Engineering and th…
Statistics
ISBN:
9781305251809
Author:
Jay L. Devore
Publisher:
Cengage Learning
Statistics for The Behavioral Sciences (MindTap C…
Statistics
ISBN:
9781305504912
Author:
Frederick J Gravetter, Larry B. Wallnau
Publisher:
Cengage Learning

Elementary Statistics: Picturing the World (7th E…
Statistics
ISBN:
9780134683416
Author:
Ron Larson, Betsy Farber
Publisher:
PEARSON

The Basic Practice of Statistics
Statistics
ISBN:
9781319042578
Author:
David S. Moore, William I. Notz, Michael A. Fligner
Publisher:
W. H. Freeman

Introduction to the Practice of Statistics
Statistics
ISBN:
9781319013387
Author:
David S. Moore, George P. McCabe, Bruce A. Craig
Publisher:
W. H. Freeman