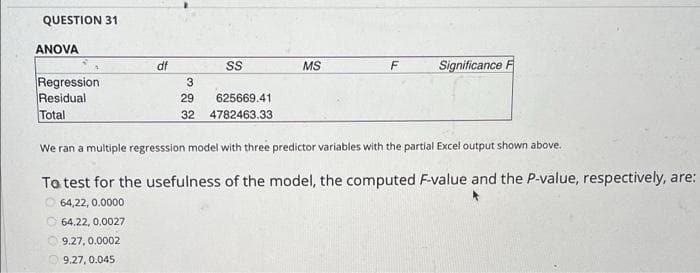
We ran a multiple regresssion model with three predictor variables with the partial Excel output shown above. To test for the usefulness of the model, the computed F-value and the P-value, respectively, are:
Q: A vending machine automatically pours soft drinks into cups. The amount of soft drink dispensed into…
A:
Q: The data below are the final exam scores of 10 randomly selected statistics students and the number…
A: We have given that, The data set are:- X :-8, 10, 7, 13, 7, 9, 9, 10, 11, 8 Y:-61, 76, 56, 84, 62,…
Q: Find the standard deviation for the given data. Round to one more decimal place than the original…
A: We have given that, Rhe data set are: X:- 3, 5, 6, 6, 9, 1 Then, We will find the standard…
Q: A researcher wants to estimate the proportion of depressed individuals taking a new anti-depressant…
A:
Q: Test the hypothesis using the P-value approach. Be sure to verify the requirements of the test. Ho:…
A: Given that Sample size n =500 Favorable cases x =410 Sample proportion p^=x/n =410/500 =0.82…
Q: mg We choose a dL We want to conduct a hypothesis test of the claim that for middle-aged adults the…
A:
Q: 6. The IQ of 8 randomly selected senior high school students are given below. 102 108 125 124 128…
A:
Q: The United States Environmental Protection Agency6 reports that in 2006, each American generated 4.6…
A: Please find the explanation below. Thank you
Q: partition divides the sample space into mutually exclusive events. True or False
A: We have given the following statement.
Q: The computer-science aptitude score, x, and the achievement score, y (measured by a comprehensive…
A: For the given data Find The equation of the line of best fit = ? se2 = ?
Q: Assume the random variable X has a binomial distribution with the given probability of obtaining a…
A: given data n = 5 p = 0.6 X ~ Bin ( 5, 0.6) P(X=r) = nCr*pr(1-p)n-r
Q: Suppose X and Y are independent random variables. X is uniformly distributed on (0, ) and Y is…
A:
Q: What is the P-value for the following scenario: A pet association claims that the mean annual costs…
A: What is the P-value for the following scenario: A pet association claims that the mean annual…
Q: The claim is that for 7 AM body temperatures of males, the mean is less than 98.6°F. The…
A:
Q: In a study of marital status and depression the data was summarized in the following table…
A: Depressed Not Depressed Total Married 500 100 600 Single 300 200 500 Total 800 300 1100
Q: Direction: Solve the sample size based on the indicated population size and margin of error: a)…
A: Since you have posted a question with multiple subparts, we will solve first three subparts for you.…
Q: In a local teaching district, a technology grant is available to teachers in order to install a…
A: Given that n=250 , X=142
Q: The International Air Transport Association surveys business travelers to develop quality ratings…
A: For the given data Find the 95% C.I
Q: The following are figures on the numbers of burglaries committed in a city in random samples of six…
A: Given: Spring : 36, 25, 32, 38, 28, 35Fall : 27, 20, 15, 29, 18, 22 Significance level is 0.01
Q: Your medical research team is investigating the mean cost of a 30-day supply of a certain heart…
A:
Q: The failure of a car's engine follows a Weibull distribution. Such failure rate is described by a…
A:
Q: Hubert paid a total of $3,250 for 250 shares of stock. He sold the stock for $11.70 per share and…
A: The profit is the amount which a dealer gains in a deal. In that case, the amount spent is smaller…
Q: For a sample size of 115 and a population parameter of 0.1, what is the standard error of the…
A:
Q: The following logit model from J.S Cramer on the household budget survey of 980 was based on a…
A: The logit model representing the car ownership as a function of income is given as follows:…
Q: The distribution of x – xn+1 is
A:
Q: Their scores are given below. 85 83 82 79 92 93 78 81 85 90 80 74 Determine the following: a.…
A: Given There was a total of 12 master's students N=12
Q: Test the claim about the differences between two population variances o and o at the given level of…
A:
Q: Sound it out: Phonics is an Instructional method in which children are taught to connect sounds with…
A: It is given that sample mean is 34.13 and the standard deviation is 23.19.
Q: ipanying abld SHOWS the earnings per share (in dollars) and the dividends per share (in dollars) for…
A: The answers are given below
Q: Mercury is a toxic metal that is used in many industrial applications. Seven measurements, in…
A: In question, Given that seven measurements in milligrams per cubic meter were taken of the mercury…
Q: Let z be a random variable with a standard normal distribution. Find the indicated probability.…
A:
Q: Source of Variation p-value Machine 0.3216 Operator Binder 0.0241 0.0072
A: Solution: The given table is
Q: A surprising number of young adults (ages 19 to 25) still live in their parents' homes. A random…
A:
Q: 2. Income is not normally distributed; instead, it is skewed right. This is because there are a few…
A: From the question, Part(a). If we take a too large sample from any population then the mean of the…
Q: How to make a 7 qc tools histogram? Construct a histogram based on the following results obtained…
A: Histogram is data visualization tool used for showing frequencies for interval of values.
Q: The standard deviation of test scores on a certain achievement test is 11.4. A random sample of 80…
A:
Q: When testing a new drug, scientists measure the amount of the active ingredient that is absorbed by…
A:
Q: Five observations where generated from exponential distribution with mean 10 and cdf F(x) =1-…
A:
Q: The usual purpose of an experiment is to O a) test a model that is based on a hypothesis. b)…
A: We have given the following statement about the purpose of the experiment.
Q: Hypotheses for a test are given, as well as some information about the sample. Indicate where the…
A: It is given that the null and alternative hypotheses are: H0: ρ=0 vs Ha: ρ<0
Q: valdes o necessary to lest he O A. 11.833 O B. 12.821 O c. 11.383 O D. +2,306
A: Given
Q: 2013428709x0134287098
A: According to the given information in this question We need to multiply these numbers
Q: The data show the bug chirps per minute at different temperatures. Find the regression equation,…
A:
Q: Question 11 You collect data on N= 15 student weights and find that the average student weight (X)…
A: Solution -Given that xbar=125 pounds The sample standard deviation s=17.2 pounds Confidence level…
Q: Suppose the heights of the mountains in a particular mountain range are normally distributed with a…
A: We have given that Mean, μ = 4410 Standard deviation, σ = 354 Z-Score, z = ( x - μ )/σ
Q: A coin-operated drink machine was designed to discharge a mean of 7 fluid ounces of coffee per cup.…
A: Given: μ = 6.86 σ = 0.2 n = 16 α = 0.05
Q: A researcher at the University of Dallas hypothesized that engaging in new and challenging cognitive…
A: Given Information: Treatment group: Sample size nTreatment=51 Sample mean mTreatment=28.972 Sample…
Q: A national study report indicated that 20.9% of Americans were identified as having medical bill…
A: For the given data Find Critical value =?
Q: Winston, a dog, loves to play fetch. He catches each ball mid-air independently with probability…
A:
Q: For the transition matrix P below of a regular Markov chain, find the fundamental matrix Z and use…
A:
Step by step
Solved in 2 steps with 2 images
- The least-squares regression line relating two statistical variables is given as = 24 + 5x. Compute the residual if the actual (observed) value for y is 38 when x is 2. 4 38 2In a multiple linear regression model with 3 predictor variables, what is the t-statistic for the hypothesis test of the null hypothesis that the coefficient of the second predictor variable is equal to 0, if the estimated coefficient is 0.5, the standard error of the estimate is 0.1, and the degrees of freedom is 15?An urban community wants to show that the incidence of breast cancer is higher in their locality than in a neighboring rural area. (PCB levels were found to be higher in the soil of the urban community). If you find that in the urban community 20 out of 200 adult women have breast cancer and that in the rural community 10 out of 150 adult women have it, could you conclude, at a significance level of 0.05, that breast cancer is more prevalent in the urban community?1. The parameter of interest is:2. The hypotheses for this test are:3. The calculated test statistic is:4. The critical region is:5. Draw the critical region (make decision):6. It can be concluded that:
- A Ross MAP team is currently developing a regression model to explain the travel expense of HR consulting firms in a month (measured in thousands of dollars). So far, the team has identified the number of consultants, the number of clients, the number of air-travel trips, and the number of trips to high-expense cities (e.g., NYC, Boston, San Jose) as potential independent variables. A partial output of the corresponding regression model is in Figure 1. Use the figure to answer question 4to6 4. What is the R2 and adjusted R2 of the model? 5. What is the standard error of the estimates (serror) in thousands of dollars? 6. Based on what you can learn from this table, what is your assessment about the model? For your information, the firm with the lowest travel expense was $47K and the firm with the highest expense was $125K in the sample data.An econometrician suspects that the residuals of her model might be autocorrelated. Explain the steps involved in testing this theory using the Durbin–Watson (DW) testA researcher would like to predict the dependent variable YY from the two independent variables X1 and X2 for a sample of N=13 subjects. Use multiple linear regression to calculate the coefficient of multiple determination and test statistics to assess the significance of the regression model and partial slopes. Use a significance level α=0.01. X1 X2 Y 38.3 52.7 55.5 50.9 76 89.3 33.5 57.6 18.6 40.9 43.6 27.7 48.7 63.5 76.5 49.6 73.3 57.4 36.9 53.3 29.8 35.4 62.8 50.2 39 76.3 65.4 64.9 57.7 71.5 54.8 58 51.5 37.8 62.6 54.7 56.7 50.5 36.6 R2=F= P-value for overall model = t1=for b1, P-value = t2= for b2, P-value =
- A researcher notes that, in a certain region, a disproportionate number of software millionaires were born around the year 1955. Is this a coincidence, or does birth year matter when gauging whether a software founder will besuccessful? The researcher investigated this question by analyzing the data shown in the accompanying table. Complete parts a through c below. a. Find the coefficient of determination for the simple linear regression model relating number (y) of software millionaire birthdays in a decade to total number (x) of births in the region. Interpret the result. The coefficient of determination is 1.___? (Round to three decimal places as needed.) This value indicates that 2.____ of the sample variation in the number of software millionaire birthdays is explained by the linear relationship with the total number of births in the region. (Round to one decimal place as needed.) b. Find the coefficient of determination for the simple linear regression model…Consider the multiple regression model shown next between the dependent variable Y and four independent variables X1, X2, X3, and X4, which results in the following function:Ŷ = 33 + 8X1 − 6X2 + 16X3 + 18X4For this model, there were 35 observations; SSR = 1,544 and SSE = 600. Assume a 0.01 significance level.Based on the given information, which of the following conclusions is correct about the statistical significance of the overall model? Multiple Choice Reject the null hypothesis that β3 = 0. Do not reject the null hypothesis that β1 = β2 = β3 = β4 = 0. Reject the null hypothesis that β1 = 0. Reject the null hypothesis that β1 = β2 = β3 = β4 = 0.The owner of Showtime Movie Theaters, Inc., would like to predict weekly gross revenue as a function of advertising expenditures. Historical data for a sample of eight weeks follow. Weekly Gross Revenue ($1000s) Televison Advertising ($1000s) Newspaper Advertising ($1000s) 97 6 1.5 90 2 2 95 5 1.5 93 3.5 2.5 95 3 4.3 95 3.5 3.3 95 3.5 4.2 95 4 2.5 a. Use alpha= 0.01 to test the hypotheses Ho : Beta Sub1= Beta Sub2 =0 Ha : Beta Sub1 and/or Beta Sub2 is not equal to zero for the model y=Beta Sub 0+ Beta Sub1 Xsub1+Beta Sub2 Xsub2+E , where X1= television advertising ($1000s) X2+ newspaper advertising ($1000s) Compute the F test statistic (to 2 decimals). Use F table. What is the p-value? - Select your answer -less than .01between .01 and .025between .025 and .05between .05 and .10greater than .10Item 2 What is your conclusion? - Select your answer -The overall model is not significantThe overall model is significantItem 3 b. Use alpha =0.05 to…
- Suppose the simple linear regression model, Yi = β0 + β1 xi + Ei, is used to explain the relationship between x and y. A random sample of n = 12 values for the explanatory variable (x) was selected and the corresponding values of the response variable (y) were observed. A summary of the statistics is presented in the photo attached. Let b1 denote the least squares estimator of the slope coefficient, β1. What is the value of b1?The Turbine Oil Oxidation Test (TOST) and the Rotating Bomb Oxidation Test (RBOT) are two different procedures for evaluating the oxidation stability of steam turbine oils. An article reported the accompanying observations on x = TOST time (hr) and y = RBOT time (min) for 12 oil specimens. TOST 4200 3600 3750 3650 4050 2770 RBOT 370 345 375 315 350 205 TOST 4870 4525 3450 2700 3750 3325 RBOT 400 380 285 220 345 290 (a) Calculate the value of the sample correlation coefficient. (Round your answer to four decimal places.) r = Carry out a test of hypotheses to decide whether RBOT Time and TOST time are linearly related. (Use ? = 0.05.) Calculate the test statistic and determine the P-value. (Round your test statistic to two decimal places and your P-value to three decimal places.) t = P-value =Suppose a researcher is interested inthe effectiveness in a new childhood exercise program implemented in a SRS of schools across a particular county. In order to test the hypothesis that the new program decreases BMI (Kg/m2), the researcher takes a SRS of children from schools where the program is employed and a SRS from schools that do not employ the program and compares the results. Assume the following table represents the SRSs of students and their BMIs. Student intervention group BMI (kg/m2) Student control group BMI (kg/m2) A 18.6 A 21.6 B 18.2 B 18.9 C 19.5 C 19.4 D 18.9 D 22.6 E 24.1 F 23.6 A) Assuming that all the necessary conditions are met (normality, independence, etc.) carry out the appropriate statistical test to determine if the new exercise program is effective. Use an alpha level of 0.05. Do not assume equal variances.B) Construct a 95% confidence interval about your estimate for the average difference in BMI between the groups.