advertised claim for batteries for cell phones is set at 48 operating hours, with proper charging procedures. A study of 5000 batteries is carried out and 15 of them stop operating prior to 48 hours. Do these experimental results reject the claim that no more than 0.2 percent of the company' batteries will fail during the advertised time period, with proper charging procedures? Use a hypothesis- testing
Q: 1. x = 7.7 μ = 8.1 a = 5 n = 135 2. x= 19.8 S = 4 μ= 18.3 n = 11 3. x = 12.5 S = 3 μ = 10.75 n = 18
A: As per our guidelines we are supposed to answer only 3 subpart of any questions so i am solving…
Q: Remember the formula for the 80% confidence interval of a single proportion(see picture) : what is…
A:
Q: Two suppliers manufacture plastic gear used in a laser printer. The impact strength of these gears…
A:
Q: exam with µ = 52, a person has a score of X = 44. Which value for the standard deviation would give…
A: From the given information we find the solution.
Q: For number 6 to 8, use the given data below to answer the following questions. There are 9 students…
A:
Q: Using the small model estimated above, what is the predicted percent boosted for a relatively…
A: Solution: The estimated regression equation is Booster^=30.0-20.0 Repub+3.0Educ-1.0Repub*Educ
Q: alysis for it. I also want you to make a boxplot to confirm the assumptions of t-test which is…
A: Systolic blood diastolic blood Systolic blood pressure (after 1 hour) diastolic blood pressure…
Q: A survey indicates that 20% of the people who earn less than $42000 per year are homeowners. If a…
A:
Q: A businessman is considering investing in the small business. A random sample of 40 companies…
A: Givensample size(n)=40Mean(x)=5.4%=0.054standard deviation(s)=1.8%=0.018
Q: According to The National newspaper, more than 80% of adults in the UAE are playing mobile games. In…
A: Solution: Given information: n= 256 Sample size of adults x= 231 adults play the mobile games…
Q: Itinerary Planning and Packaging Reservations Travel Counseling Tour Guiding Other General Skills…
A:
Q: A homeowner plants 6 bulbs selected at random from a box containing 5 tulip bulbs and 4 daffodil…
A: Solution-: We have 5 tulip bulbs and 4 daffodil bulbs. Total number of bulbs =5 (tulip bulbs)+4…
Q: In a quantitative analysis where widowed people suffering with bereavement suffer with a poor…
A: Solution: Given that in a quantitative analysis where widowed people suffering with bereavement…
Q: 2. A If the population is infinite or the population is finite in which sampling is with…
A: Given that
Q: Asymptotic Properties of MLES ... 'F Let X₁, X2, X3, Xn be a random sample from a distribution with…
A:
Q: Direction: Complete the following statements. _____________ is a point on the test distribution…
A: According to policy, we supposed to answer first question, kindly repost remaining question.
Q: Do Generation X and Boomers differ in how they use credit cards? A sample of 1,000 Generation X and…
A: Since you have posted a question with multiple sub-parts, we will solve first three subparts for…
Q: Researchers wondered if there was a difference between males and females in regard to some common…
A: Given that For Male Number of person(n)=507 Number of respond (X)= 168 For Female Number of…
Q: = Pq N- n N-I N: populati
A:
Q: The accompanying data set lists diastolic blood pressure measurements (mm Hg) of females. All of the…
A:
Q: The histogram and cumulative percentage polygon below visualize the property taxes per capita for 36…
A: The histogram and cumulative percentage polygon below visualize the property taxes per capita for 36…
Q: QUESTION TWO. The marketing department of a major personal fragrance company was trying to ascertain…
A:
Q: What are the null and alternative hypotheses? Choose the correct answer below. OA. Ho: 51,700…
A: It is given that Population mean, μ = 51700 Sample mean, x̅ = 52354 Sample standard deviation, s =…
Q: You are given the sample mean and the population standard deviation. Use this information to…
A: Given Mean=110.50 Standard deviations=10.76 n=44
Q: researcher wants to know if the clothes a woman wears is a factor in her GPA. The table below shows…
A: Solution: To test the hypothesis Ho:μ1=μ2=μ3=μ4 VS H1: At least two of the populations means…
Q: 3. In a normal distribution whose mean is 2 and S.D. 3, find a value of the variate such that the…
A:
Q: 2. If the population is infinite or the population is finite in which sampling is with replacement,…
A: Given that If the population is infinite or finite in which the sampling is with replacement then…
Q: Assume that you have a sample of n₁ = 8, with the sample mean X₁ = 42, and a sample standard…
A: Assume that you have a sample of n₁ = 8, with the sample mean X1 = 42, and a sample standard…
Q: Construct the indicated confidence interval for the population mean μ using the t-distribution.…
A: From the provided information, Sample size (n) = 5 Sample mean (x̄) = 12.5 Standard deviation (s) =…
Q: a. Find the sufficient statistic of 0. b. Show that the probability density function 3nx3n-1…
A:
Q: Assume that 100 students are registered for the course. a) What is the probability that two or…
A: Let X be the number of students withdraw without completing the introductory business analytics…
Q: In a random sample of six mobile devices, the mean repair cost was $80.00 and the standard deviation…
A: Given n=6 Alpha=0.01 Mean=80.00 Standard deviations=13.00
Q: The life table below is for a species of lizard. Use it to answer the questions below. It can be…
A:
Q: A professor claims that students who have faster typing speed (in words per minute) tend to have…
A: Here's, correlation coefficient is 0.3234 which is too weak relationship between them. Hence option…
Q: Researchers wondered if there was a difference between males and females in regard to some common…
A: Given Data n1 = 522 x1 = 202 n2 = 505 x2 = 171
Q: Consider the hospital emergency department visits shown in table below. People may leave without…
A:
Q: Construct all random samples consisting two observations from the given data. You are asked to guess…
A: Given information: Watermelon A, B, C, D, E, and F has a weight (in pounds) 19, 14, 15, 9, 10 and 17…
Q: Blue Brown Green Orange Red Yellow Total Observed Frequencies 642 364 474 540 333 381 2734 Expected…
A:
Q: Vp = Pq n
A: Given that
Q: 7. A paper in Quality Engineering [2013, Vol. 25(1)] presented data on cycles to failure of solder…
A:
Q: A population consists of the numbers 4, 6, 11, 12 and 7. List all the possible size of 3 from this…
A:
Q: A popular theory is that presidential candidates have an advantage if they are taller than their…
A: Given that We have to conduct hypothesis for the claim that presidents trends to be taller than…
Q: Suppose the following information is collected on an application for a loan. a. Current debt:…
A: Solution-: We classify the following responses by type of data (a) Current debt: $149,720 (b) Number…
Q: Los Angeles workers have an average commute of 29 minutes. Suppose the LA commute time is normally…
A:
Q: What type of error (Type I or Type II) do you risk incurring with the decision that you made in #3?
A: We need to find the type of error (Type I or Type II) with the decision that is made in #3.
Q: D. 20 For number 6 to 8, use the given data below to answer the following questions. "There are 9…
A:
Q: Identify which sampling method is applied in the following situations. 1. The teacher randomly…
A: Given that
Q: TRY MORE Use the distribution table below to find the following measures of position. Show your…
A: Given data is Scores Frequency Cumulative Frequency 90-94 3 50 85-89 23 47 80-84 14 24…
Q: The quality-control manager at a compact fluorescent light bulb (CFL) factory needs determine…
A: Given : sample size, n =49 sample mean, x̄ =7297 population standard deviation,σ=840…
Q: Rhenz scored 32 points on their Math summative test. The following data are the summative test…
A: We create the class interval then we count the frequencies for every class.
testing with alpha= 0.05
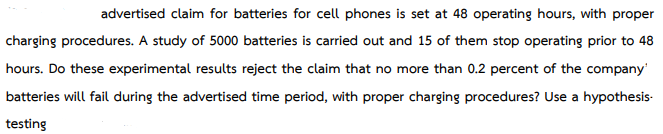
Step by step
Solved in 2 steps with 1 images
- In previous years, 46% of candidates taking a Business Analytics exam have passed and have therefore been exempt from one prerequisite course. Resources made available such as tutoring and library prep books have improved the passing rates of candidates. In a sample of 300 recent applicants, 150 passed the exam. At the 0.01 level of significance, can we conclude that the proportion of candidates passing the exam has increased? Determine and interpret the p value for the test.A car manufacturer claims that less than 10% of its cars should need repairs in the first three years of their life, the warranty period. A random sample of 50 three-year-old cars found that 8 had required attention. Does this contradict the maker’s claim? Test the car manufacturer’s claim. c) Calculate the value of the test statistic to test the hypothesis.Based on past record of a pharmaceutical company, the cure rates for a standardmedication in treating a particular ailment is ten percent. After five years, thecompany has produced a new medication. The hired pharmacist in the companyclaims that the new medication produced by the company is effective in treating aparticular ailment compared to a standard medication. In a simple randomsample of two hundred subjects who took the new medication, it was found thatsixty subjects are uncured. Meanwhile, one hundred and eighty subjects arecompletely cured from three hundred subjects who took the standard medication.Given that the 97.8% confidence interval for the cure rates of the standardmedication is (0.5352, 0.6648). Can we conclude that the cure rates of thestandard medication do not change from the past record?
- Historically, the proportion of students entering a university who finished in 4 years or less was 65%. To test whether this proportion has decreased, 150 students were examined and 58% had finished in 4 years or less. At the 5% level of significance, does it appear the proportion has decreased from its historical level? To determine whether the proportion of students who finish in 4 year or less has statistically significantly decreased, what is the null and alternative hypothesis?In a study of the accuracy of fast food drive-through orders, one restaurant had 40 orders that were not accurate among 310 orders observed. Use a0.10significance level to test the claim that the rate of inaccurate orders is equal to 10%. Does the accuracy rate appear to be acceptable? Identify the null and alternative hypotheses for this test. test statistic pvalue conclusionHistorically, the proportion of people who trade in their old car to a car dealer when purchasing a new car is 48%. Over the previous six months, in a sample of 115 new car buyers, 46 have traded in their old car. To determine (at the 10% level of significance) whether the proportion of new car buyers that trade in their old car has this is  statistically significantly decreased, what can you conclude concerning the null hypothesis? A) reject the null hypothesis Or B) fail to reject the null hypothesis
- state whether the investigation in question is an observational study or a designed experiment. Justify your answer in each case. Do Left-Handers Die Earlier? According to a study published in the Journal of the American Public Health Association,lefthanded people do not die at an earlier age than right-handed people, contrary to the conclusion of a highly publicized report done 2 years earlier. The investigation involved a 6-year study of 3800 people in East Boston older than age 65.Researchers at Harvard University and the National Institute of Aging found that the “lefties” and “righties” died at exactly the same rate. “There was no difference, period,” said Dr. J. Guralnik, an epidemiologist at the institute and one of the coauthors of the report.Recently, a large academic medical center determined that 13 of 20 employees in a particular position were female, whereas 41% of the employees for this position in the general workforce were female. At the 0.01 level of significance, is there evidence that the proportion of females in this position at this medical center is different from what would be expected in the general workforce? Question content area bottom Part 1 What are the correct hypotheses to test to determine if the proportion is different? A. H0: π≤0.41; H1: π>0.41 B. H0: π≥0.41; H1: π<0.41 C. H0: π=0.41; H1: π≠0.41 D. H0: π≠0.41; H1: π=0.41 Part 2 Calculate the test statistic. ZSTAT=enter your response here (Type an integer or a decimal. Round to two decimal places as needed.) Part 3 What is the p-value? The p-value is enter your response here. (Type an integer or a decimal. Round to three decimal places as needed.) Part 4 State…What Proportion of College Students Are Satisfied with Their Overall Academic Expereince? Exercise 2.16 introduces a survey of 5204 first-year full-time college students in the US. The survey was administered at the end of the first year, and 4122 of the students in the sample said that they were satisfied with their overall academic experience during the first year. Does the data from this sample provide evidence that more than 75% of US full-time students are satisfied with their overall academic experience at the end of their first year? Give all details of the hypothesis test. Test-statistic = (round to the nearest whole)p-value = (round to three decimal places)Conclusion:. Reject H0; We cannot conclude that more than 75% are satisfied. Do not reject H0; More than 75% of US students are satisfied with their overall academic experience. Do not reject H0; We cannot conclude that more than 75% are satisfied. Reject H0; More than 75% of US…
- Recently, a large academic medical center determined that 9 of 18 employees in a particular position were female, whereas 45% of the employees for this position in the general workforce were female. At the 0.05 level of significance, is there evidence that the proportion of females in this position at this medical center is different from what would be expected in the general workforce? Question content area bottom Part 1 What are the correct hypotheses to test to determine if the proportion is different? A. H0: π≠0.45; H1: π=0.45 B. H0: π≥0.45; H1: π<0.45 C. H0: π≤0.45; H1: π>0.45 D. H0: π=0.45; H1: π≠In August 2010, Massachusetts enacted a 150-day right-to-cure period that mandates that lenders give homeowners who fall behind on their mortgage an extra five months to become current before beginning foreclosure proceedings. Policymakers claimed that the policy would result in a higher proportion of delinquent borrowers becoming current on their mortgages. To test this claim, researchers took a sample of 244 homeowners in danger of foreclosure in the time period surrounding the enactment of this law. Of the 100 who fell behind just before the law was enacted, 30 were able to avoid foreclosure, and of 144 who fell behind just after the law was enacted, 48 were able to avoid foreclosure. Let p1 and p2 represent the proportion of delinquent borrowers who avoid foreclosure just before and just after the right-to-cure law is enacted, respectively. Assuming α = 0.10, does the evidence support the policymakers’ claim?In August 2010, Massachusetts enacted a 150-day right-to-cure period that mandates that lenders give homeowners who fall behind on their mortgage an extra five months to become current before beginning foreclosure proceedings. Policymakers claimed that the policy would result in a higher proportion of delinquent borrowers becoming current on their mortgages. To test this claim, researchers took a sample of 244 homeowners in danger of foreclosure in the time period surrounding the enactment of this law. Of the 100 who fell behind just before the law was enacted, 30 were able to avoid foreclosure, and of 144 who fell behind just after the law was enacted, 48 were able to avoid foreclosure. Let p1 and p2 represent the proportion of delinquent borrowers who avoid foreclosure just before and just after the right-to-cure law is enacted, respectively. Which of the following is the correct competing hypotheses that will test the policymakers’ claim? Multiple Choice H0: p1 – p2 ≥ 0,…