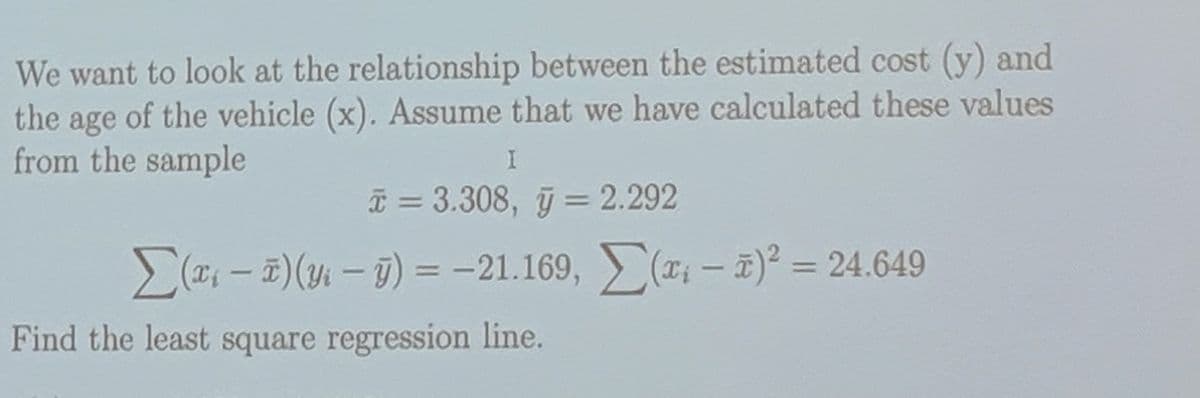
We want to look at the relationship between the estimated cost (y) and the age of the vehicle (x). Assume that we have calculated these values from the sample I x = 3.308, y = 2.292 Σ(x-2)(y₁ - y) = -21.169, (-)² = 24.649 Find the least square regression line.


Q: The distribution of average hours of sleep per weeknight among college students is found to be…
A: Given that. X~N( μ , ?^2 ) μ=6.5 , ?=1.0 Z-score =( x - μ )/?
Q: Use the following cell phone airport data speeds (Mbps) from a particular network. Find P10. 0.2…
A: Introduction A percentile is a metric that measures up a specific score to the ratings of other…
Q: Question: How many degrees of freedom are there in the distribution of the test statistic for the…
A: Solution-: How many degrees of freedom in the distribution of the test statistic for the regression…
Q: d-Hd Evaluate t = - for d= -0.375, μ = 0, så = 3.623, and n = 8. Sd √n
A:
Q: Show how to use Hausman Test B₁ B₂ under Ho Consistent, Efficient Consistent, less Efficient under…
A: The Hausman test is used to decide whether the estimate of an unknown parameter is consistent or…
Q: In a small private college, 80 students play baseball, 70 students play football, 50 students play…
A: Given that We have to the probability that he/she
Q: To the nearest whole number, what percent of respondents did not choose Dominos or Marcos as their…
A: Given that: The frequency of each respondent's favorite pizza shop is recorded and shown in the…
Q: X1 and X2 are indep N(0,1) random variables. Y1=(X1+X2)/2 and Y2={(X1-X2)^2}/2. let 1. find the mgf…
A: Given: X1 and X2 are independent N(0,1) random variable: Y1=X1+X22Y2=X1-X222
Q: Determine the area under the standard normal curve that lies between (a) Z=−0.21 and Z=0.21, (b)…
A: (a) The given z values are z=-0.21 and z=0.21.
Q: Consider the table below. Classes Frequency, Cumulative Midpoint, fm fm² (Mass) Frequency m (kg)…
A: Mid value=(Upper limit+ lower limit)/2
Q: Listed below are the measured radiation absorption rates (in W/kg) corresponding to 11 cell phones.…
A: The given observations of measured radiation absorption rate are: 1.49, 0.79, 0.72, 1.25, 0.85,…
Q: One study claimed that 88 % of college students identify themselves as procrastinators. A professor…
A:
Q: Exam scores for 28 students are shown below. calculate the percentile for a student whose exam,…
A: Given data of exam scores for 28 students;(in ascending order)…
Q: Normal Distribution Characteristics of Normal Distributions: Standard Deviation- Z-score • What does…
A: Given that Mean = 63 , Standard deviation = 2 X-score = 68
Q: identifying the sample space for a couple having four children, find the probability of getting…
A: It is given that the same space of three children. Here, need to find out the sample space of four…
Q: Annual Cost of College. The increasing annual cost (including tuition, room, board, books, and fees)…
A: In the parametric test, the population follows the assumption of any distribution. If the population…
Q: Use the given information to draw a Venn diagram. (ANBNC)=3, n(ABC)=8, (Ac)-4, Ananc)= 9, (Annc²) =…
A: Venn Diagram for three events :
Q: Sxx (@) XY Find the cross correlation function. 1 -w² + j4w+4
A:
Q: Find the value of zα. z0.09 z0.09=enter your response here (Round to two decimal places as…
A:
Q: alculate the median of the data shown, to two decimal places, 24.4,11.1,2.1,29,8.7,6.9,6.6,1.1
A: The given data is 24.4,11.1,2.1,29,8.7,6.9,6.6,1.1
Q: Find the proportion of Normally distributed observations with a zz-score above -1.94. Give your…
A: Given: Z-score = -1.94 To find: P(Z > -1.94) = ?
Q: Question 6 of 30 Step 1 of 1 The president of the college asked a sorority to submit a list of 8…
A: Combination: It is nothing but the selection of objects where the order of selection is not…
Q: The following describes a sample. The information given includes the five number summary, the sample…
A: Solution
Q: For a normally distributed random variable mean is 46 and standard deviation is 13. Find the Z score…
A: Answer: From the given data, Population mean (μ) = 46 Population standard deviation (σ) = 13
Q: could give the answer of this question as a fraction thanks
A:
Q: Regarding the Chi-Square test for frequencies, which of the following is false? a. observed…
A: Introduction: It is required to identify the correct option.
Q: Determine the Mean Squared Error (MSE) using a 3-week simple moving average. Week Sales 73 178 82 89…
A: The data for weekly sales is given.
Q: Four scenarios of statistical studies are given below. Decide which study uses a population…
A: Given that Four scenarios of statistical studies are given below. Decide which study uses a…
Q: 23. Teen smoking 2009 The Centers for Disease Control and Prevention say that about 19.5% of…
A: Given that: Population proportion, p=0.195 (i.e., 19.5%) Sample size, n=522
Q: Consider the following example survey results of 18-34 years olds in the United States, in response…
A: Given that We have to find: Develop the joint probability table for these data and use it to…
Q: O Suppose that you enter a fantasy basketball league. Suppose that the 2022 team budget, say X, is…
A: The following solution is provided below:
Q: researcher computes the correlation coefficient r =r= -0.2512 for an explanatory and response…
A:
Q: Consider the following regression model: Dependent Variable: MU Sample: 134
A: Solution The given analysis is the regression analysis.
Q: thats what i got aswell when i worked it but its saying that the answer is incorrect
A: Solution To fund the probability we will use Bayes theorem.
Q: The number of chocolate chips in an 18-ounce bag of chocolate chip cookies is approximately…
A:
Q: A senate committee consists of 5 Republicans, 6 Democrats, and 2 Independents. A subcommittee of 3…
A: a) There are 5 Republicans, 6 Democrats, and 2 Independents.
Q: November 2017 Gallup Poll of 10281028 U.S. adults found that 627627 are satisfied with the total…
A: Total =1033 Satisfied = 627 Margin of error = +-4%
Q: cations, where forming. at is the fractic
A: Here we have given two process 1 and process 2 to test that their proportion differ from each other…
Q: ► The quantile regression estimator is the sample analog of whereby F(Y, X) is replaced by the EDF…
A: The quantile regression Process: Consider Qyτ|x be the τ-conditional quantile of Y given X=x…
Q: Camila sets up a passcode on her smart phone, which allows only five-digit codes. A spy sneaks a…
A: By the word Permutation, it means arrangement. When a certain number of objects are selected from…
Q: QUESTION ONE A. The following table lists the number of days that 15 houses in a particular area…
A: Given: n = 15 Formula Used: Mean X = ∑Xin Standard deviation s = ∑Xi-X2n-1 Z-score = X-Xs
Q: the following refer to the following data set, 40.5,36.2,62,62.46.2,62,28.1,53,48.4,39.6. a. what…
A: Given: n = 10 Formula Used: Arithmetic mean X = ∑Xin Median = 2(n+1)4thterm Mode = The data point…
Q: Find the proportion of Normally distributed observations with a zz-score below 3.48. Give your…
A: Let Z be the random variable from standard normal distribution with mean (μ) = 0 standard deviation…
Q: With respect to regression, which of the following is false? a.when the value of b = 0, the…
A: The simple linear regression has the following equation: y=a+bx a and b are the regression…
Q: I don't understand your answer. since there is 1,2,3,4,5,6 choices. what is/are your choices?
A: *value of probability lies between (0 to 1) always * for valid probability density function value of…
Q: Let Y₁, Y₂, Y3, Y₁, Ys be a random sample of size 5 from a standard normal population. Find the…
A: Given Y1,Y2,Y3,Y4, Y5 is a random sample of size 5 from a standard normal population. Here we should…
Q: A manufacturer of phone batteries determines that the average length of talk time for one of its…
A: Answer:- Given, A manufacturer of phone batteries determines that the average length of talk time…
Q: Find median 16,17,35,36,48,39,40
A: Given data: 16,17,35,36,48,39,40 Total number of observations, n=7
Q: Q3: PVC pipe is manufactured with a mean diameter of 1.01 inch and a standard deviation of 0.003…
A: Given that Mean = 1.01 , Standard deviations = 0.003 Sample size = n = 9
Q: r=√r2=√0.852
A: Given: Coefficient of determination r2 = 0.852 Formula Used: Correlation coefficient r = Coefficient…
Find the least square regression line.

Step by step
Solved in 2 steps

- Olympic Pole Vault The graph in Figure 7 indicates that in recent years the winning Olympic men’s pole vault height has fallen below the value predicted by the regression line in Example 2. This might have occurred because when the pole vault was a new event there was much room for improvement in vaulters’ performances, whereas now even the best training can produce only incremental advances. Let’s see whether concentrating on more recent results gives a better predictor of future records. (a) Use the data in Table 2 (page 176) to complete the table of winning pole vault heights shown in the margin. (Note that we are using x=0 to correspond to the year 1972, where this restricted data set begins.) (b) Find the regression line for the data in part ‚(a). (c) Plot the data and the regression line on the same axes. Does the regression line seem to provide a good model for the data? (d) What does the regression line predict as the winning pole vault height for the 2012 Olympics? Compare this predicted value to the actual 2012 winning height of 5.97 m, as described on page 177. Has this new regression line provided a better prediction than the line in Example 2?When is the standard error of the estimate (in linear regression) large? When the X values are very close to the Y values. When the residuals are large on average. When the average distance between actual Y scores and predicted Y scores is small. When the coefficient of determination is small.Suppose that the sales of a company (Y) is regressed on advertising expenditure (x) and labor cost (z), and the estimated regression equation is Y = 5 + 0.5x + 0.7z + u (where u is the error term). Here, sales, advertising expenditure and labor cost are measured in million Tk. Standard error for the coefficient of x is 0.04, standard error for the coefficient of z is 0.01, and the sample size is 20. Can we conclude that advertising expenditure is a statistically significant variable?
- Given a generic data set (x,y) with a linear regression. How do you determine if the y(dependent) will be less/greater than a certain value at a decided value of x?Suppose that researchers are interested in determining the bi-annual salary of statisticians of different levels using their years of experience and their education level (M = bachelors, P = doctorate). They fit the following model to a dataset that includes these variables and, after performing the proper steps of multiple linear regression, the following multiple linear regression model is obtained: yˆ = 42308 + 323x1 + 213x2 + 301(x1*x2) where the variables are as follows: yˆ = predicted bi−annual salary in dollars, x1 = number of years of experiencex2= {1 if the education level is a doctorate 0 if the education level is a bachelors What is the predicted bi-annual salary in dollars of an employee with 5 years of experience and a bachelor’s degree?Suppose that researchers are interested in determining the bi-annual salary of statisticians of different levels using their years of experience and their education level (M = bachelors, P = doctorate). They fit the following model to a dataset that includes these variables and, after performing the proper steps of multiple linear regression, the following multiple linear regression model is obtained: yˆ = 42308 + 323x1 + 213x2 + 301(x1*x2) where the variables are as follows: yˆ = predicted bi−annual salary in dollars, x1 = number of years of experiencex2= {1 if the education level is a doctorate 0 if the education level is a bachelors What is the predicted bi-annual starting salary of an employee with a doctorate degree? (Someone with no work experience). $ What is the predicted bi-annual starting salary of an employee with a bachelor’s degree? (Someone with no work experience). $
- It is required to use the data given in the table to estimate the parameters of the simple linear regression equation by any of the estimation methods:The data regarding the production of wheat in tons (X) and the price of the kilo of flour in Ghana cedis (Y) Takoradi some years ago were: a. Fit the regression line for the day using the method of least squaresWhat is the effect of this violation on the regression model? "The number of observations n is less than or equal to the number of parameters to be estimated"
- A county real estate appraiser wants to develop a statistical model to predict the appraised value of houses in a section of the county called East Meadow. One of the many variables thought to be an important predictor of appraised value is the number of rooms in the house. Consequently, the appraiser decided to fit the simple linear regression model: E(y) = β0 + β1x, where y = appraised value of the house (in thousands of dollars) and x = number of rooms. Using data collected for a sample of n = 74 houses in East Meadow, the following results were obtained: = 74.80 + 19.84 xGive a practical interpretation of the estimate of the slope of the least squares line. For a house with 0 rooms, we estimate the appraised value to be $74,800. For each additional room in the house, we estimate the appraised value to increase $74,800. For each additional room in the house, we estimate the appraised value to increase $19,840. For each additional dollar of…Given a generic data set (x,y) with a linear regression. How do you determine if the y(dependent) will be less than a certain value?A fitted linear regression model is (y=10+2x ). If x = 0 and the corresponding observed value of y = 9, the residual at this observation is: