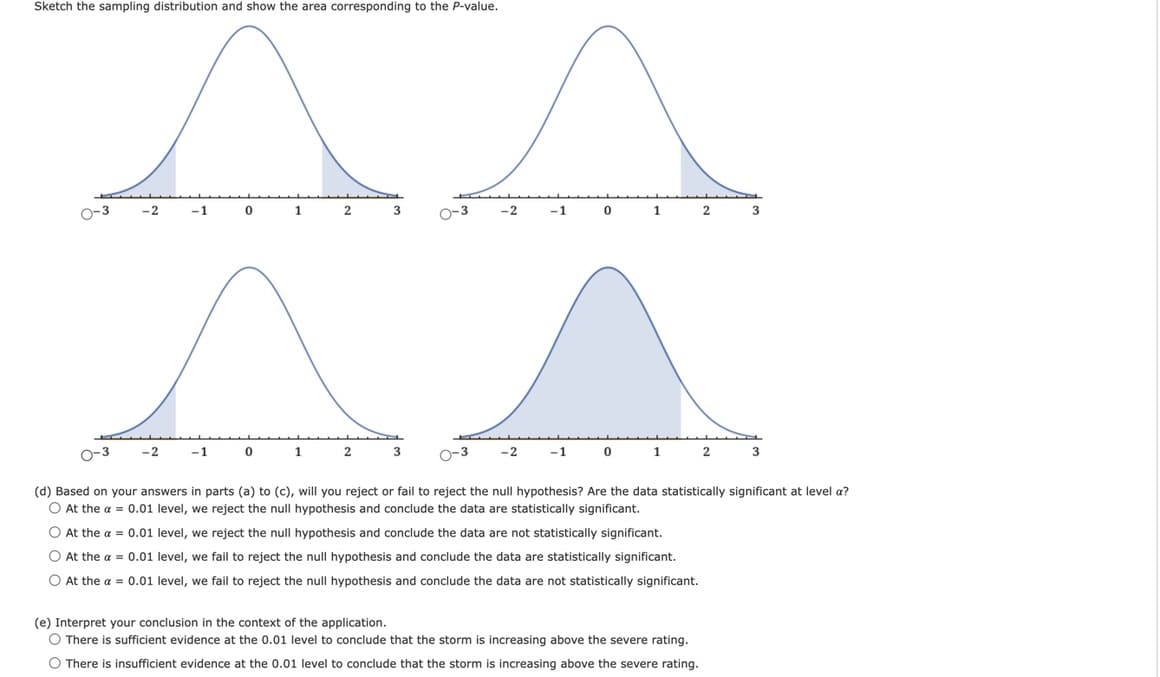
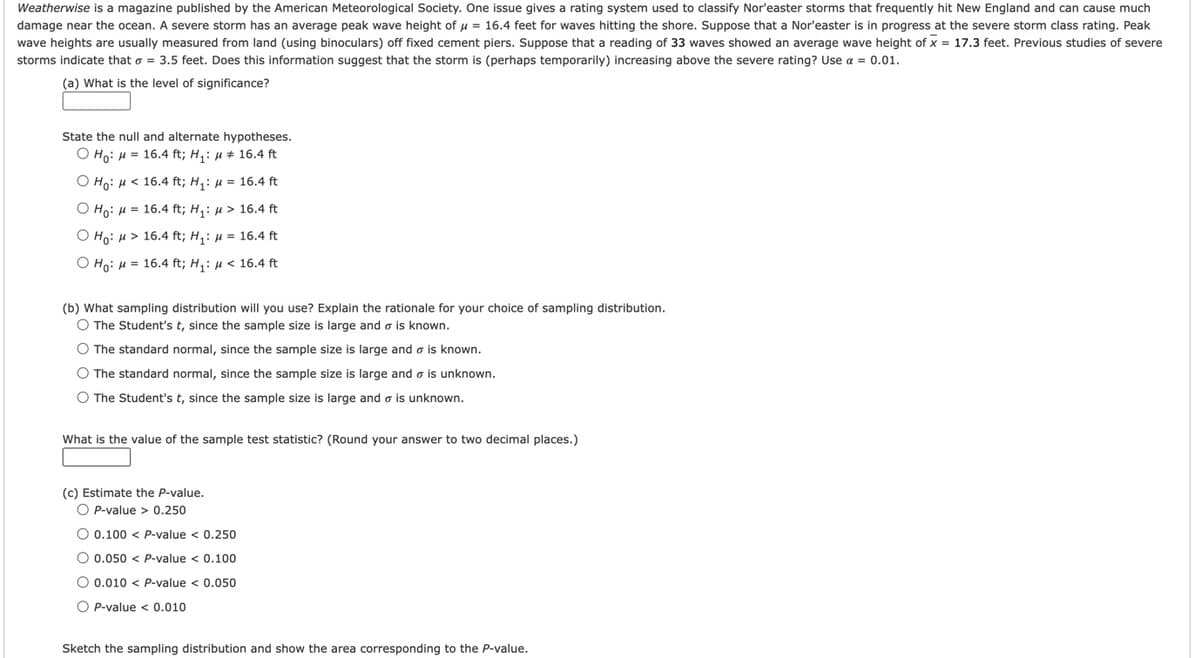
Weatherwise is a magazine published by the American Meteorological Society. One issue gives a rating system used to classify Nor'easter storms that frequently hit New England and can cause much damage near the ocean. A severe storm has an average peak wave height of ? = 16.4 feet for waves hitting the shore. Suppose that a Nor'easter is in progress at the severe storm class rating. Peak wave heights are usually measured from land (using binoculars) off fixed cement piers. Suppose that a reading of 33 waves showed an average wave height of x = 17.3 feet. Previous studies of severe storms indicate that ? = 3.5 feet. Does this information suggest that the storm is (perhaps temporarily) increasing above the severe rating? U


Weatherwise is a magazine published by the American Meteorological Society. One issue gives a rating system used to classify Nor'easter storms that frequently hit New England and can cause much damage near the ocean. A severe storm has an average peak wave height of ? = 16.4 feet for waves hitting the shore. Suppose that a Nor'easter is in progress at the severe storm class rating. Peak wave heights are usually measured from land (using binoculars) off fixed cement piers. Suppose that a reading of 33 waves showed an average wave height of x = 17.3 feet. Previous studies of severe storms indicate that ? = 3.5 feet. Does this information suggest that the storm is (perhaps temporarily) increasing above the severe rating? Use ? = 0.01.

Step by step
Solved in 5 steps


