Weber's law, a concept taught in most Introduction to Psychology courses, states that the ratio of the intensity of a stimulus to the "just noticeable" incremen intensity is constant, that is, the ratio doesn't depend on the intensity of the stimulus. The ratio is called the "Weber fraction," so a concise statement of Webe law is that "the Weber fraction is constant, regardless of the stimulus intensity." It turns out that Weber's law is not so much a law as it is a rule of thumb, sinc it is violated in many situations. For instance, for some auditory stimuli, the Weber fraction does depend systematically on the stimulus intensity. The following bivariate data are the experimental data obtained for one listener in an auditory intensity discrimination task. For each of the ten stimulus intensities x (in decibels), the Weber fraction y (in decibels) is shown. Figure 1 is a scatter plot of the data. Stimulus intensity, x (in decibels) Weber fraction, y (in decibels) 35 -0.57 40 -0.1 45 -1.46 50 -1.02 (sjaq uogpe.
Weber's law, a concept taught in most Introduction to Psychology courses, states that the ratio of the intensity of a stimulus to the "just noticeable" incremen intensity is constant, that is, the ratio doesn't depend on the intensity of the stimulus. The ratio is called the "Weber fraction," so a concise statement of Webe law is that "the Weber fraction is constant, regardless of the stimulus intensity." It turns out that Weber's law is not so much a law as it is a rule of thumb, sinc it is violated in many situations. For instance, for some auditory stimuli, the Weber fraction does depend systematically on the stimulus intensity. The following bivariate data are the experimental data obtained for one listener in an auditory intensity discrimination task. For each of the ten stimulus intensities x (in decibels), the Weber fraction y (in decibels) is shown. Figure 1 is a scatter plot of the data. Stimulus intensity, x (in decibels) Weber fraction, y (in decibels) 35 -0.57 40 -0.1 45 -1.46 50 -1.02 (sjaq uogpe.

Glencoe Algebra 1, Student Edition, 9780079039897, 0079039898, 2018
18th Edition
ISBN:9780079039897
Author:Carter
Publisher:Carter
Chapter4: Equations Of Linear Functions
Section4.5: Correlation And Causation
Problem 2AGP

Related questions
Question
Transcribed Image Text:coll8HrwEXuSuQCFg99im-_2WQpl15JPLwPXicuPnLFm?1oBw7QYjlbavbSPXbr-YCjsh
O CORRELATION AND SIMPLE LINEAR REGRESSION
Relating the sample correlation coefficient and the parameters
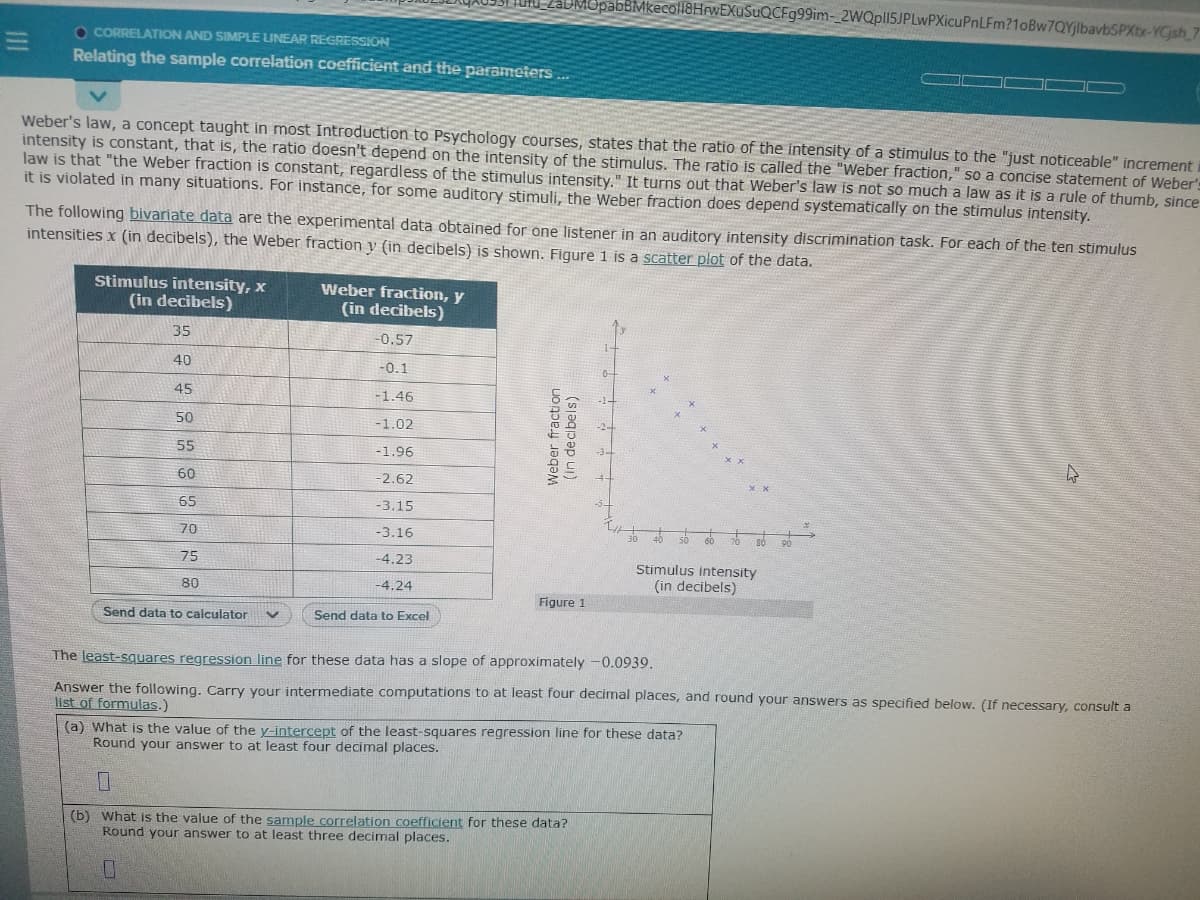
Weber's law, a concept taught in most Introduction to Psychology courses, states that the ratio of the intensity of a stimulus to the "just noticeable" increment
intensity is constant, that is, the ratio doesn't depend on the intensity of the stimulus. The ratio is called the "Weber fraction," so a concise statement of Weber's
law is that "the Weber fraction is constant, regardless of the stimulus intensity." It turns out that Weber's law is not so much a law as it is a rule of thumb, since
it is violated in many situations. For instance, for some auditory stimuli, the Weber fraction does depend systematically on the stimulus intensity.
The following bivariate data are the experimental data obtained for one listener in an auditory intensity discrimination task. For each of the ten stimulus
intensities x (in decibels), the Weber fraction y (in decibels) is shown. Figure 1 is a scatter plot of the data.
Stimulus intensity, x
(in decibels)
Weber fraction, y
(in decibels)
35
-0.57
40
-0.1
45
-1.46
50
-1.02
55
-1.96
60
-2.62
65
-3.15
70
-3.16
75
-4.23
Stimulus intensity
(in decibels)
80
-4.24
Figure 1
Send data to calculator
Send data to Excel
The least-squares regression line for these data has a slope of approximately -0.0939.
Answer the following, Carry your intermediate computations to at least four decimal places, and round your answers as specified below. (If necessary, consult a
list of formulas.)
(a) What is the value of the y-intercept of the least-squares regression line for these data?
Round your answer to at least four decimal places.
(b) What is the value of the sample correlation coefficient for these data?
Round your answer to at least three decimal places.
Weber fraction
(In decibels)
Expert Solution
This question has been solved!
Explore an expertly crafted, step-by-step solution for a thorough understanding of key concepts.

Step by step
Solved in 4 steps

Recommended textbooks for you
Glencoe Algebra 1, Student Edition, 9780079039897…
Algebra
ISBN:
9780079039897
Author:
Carter
Publisher:
McGraw Hill

Big Ideas Math A Bridge To Success Algebra 1: Stu…
Algebra
ISBN:
9781680331141
Author:
HOUGHTON MIFFLIN HARCOURT
Publisher:
Houghton Mifflin Harcourt
Glencoe Algebra 1, Student Edition, 9780079039897…
Algebra
ISBN:
9780079039897
Author:
Carter
Publisher:
McGraw Hill
Big Ideas Math A Bridge To Success Algebra 1: Stu…
Algebra
ISBN:
9781680331141
Author:
HOUGHTON MIFFLIN HARCOURT
Publisher:
Houghton Mifflin Harcourt