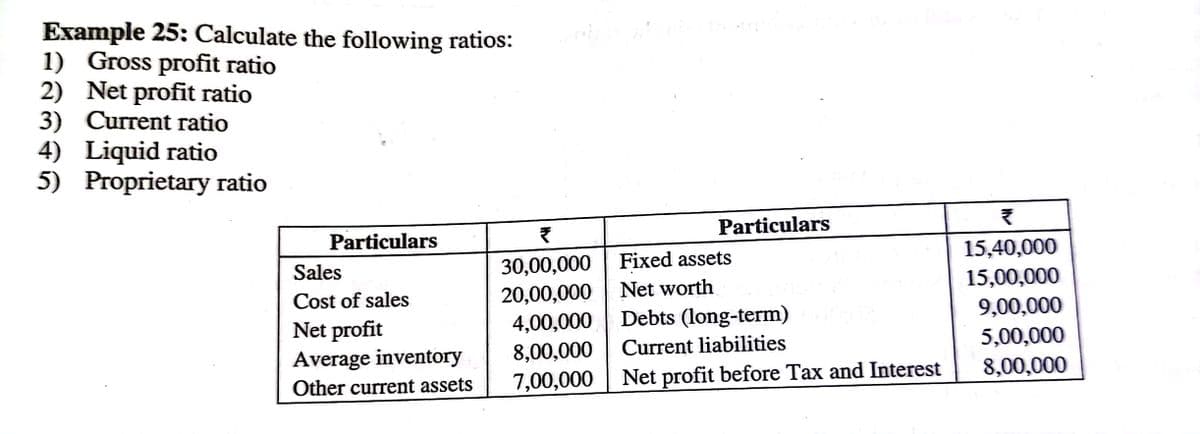
Example 25: Calculate the following ratios: 1) Gross profit ratio 2) Net profit ratio 3) Current ratio 4) Liquid ratio 5) Proprietary ratio


Q: Use Exhibit 18-1 to determine the sales tax (in $) and calculate the total purchase price (in $) for…
A:
Q: Assume the geometric mean of 6 profit growth ratios of a company is 1.2. What is the product of…
A: Consider a set of numbers x1, x2, …, xn of size n.
Q: Year 2015 2016 2017 2018 2019 2020 Price 20 21 23 28 30 35 Calculate index number. (a) Taking 2015…
A: iv) From the given information, Year 2015 2016 2017 2018 2019 2020 Price 20 21 23 28 30 35…
Q: Opening Stock was 73,00,000. Assume 360 days in a year. Compute the following ratios: 1) Current…
A:
Q: The estimated demand and supply curve for apples is displayed below. If the current price is…
A: Given the current price is $100 / ton . We have to find the demand and supply from the graph and…
Q: 1. Calculate a point estimate for the true population average unemployment duration.
A:
Q: If a population has a total number of 5 million and the total birth for the year is 500. Calculate…
A: The total population is 5 million (50,00,000) and the total birth for the year is 500.
Q: A municipal solid-waste site for a city must be located at Site A or Site B. After sorting, some of…
A: Concept: The calculus helps in understanding the changes between values that are related by a…
Q: what is the gross profit margin on the coffee tales described in question 1 above
A: Profit
Q: 10. After starting with 197 miaTograms, the mass of bacteria decreases by 22% every 2 hours. 2-hour…
A: The initial population is = P0The population at time…
Q: TABLE 3.4 Average Annual Consumer Price Index (1982-1984 = 100) Year CPI Year CPI Year CPI Year CPI…
A: "Since you asked multiple questions, we will solve the first question for you. If you want any…
Q: by (i) Laspeyre's Calculate quantity index method, (ii) Paasche's method, and (iii) Fisher's…
A:
Q: Complete the table shown to the right for the population growth model for a certain country. 2007…
A:
Q: If the currency-deposit ratio is 14% and the reserve ratio is 15%, what is the size of the money…
A: Money multiplier
Q: Estimate (i) the sales corresponding to advertising expenditure of. and (ii) the advertising…
A: Here use regression line
Q: What is the per unit variable cost?
A:
Q: From the following Table of yearly premiums for policies maturing at different ages, estimate the…
A:
Q: The margin of safety sales volume times the contribution margin ratio equals operating income. True…
A:
Q: Example 20.2 Using the data given in Table 20.2, calculate the price index for year 2, the base year…
A:
Q: 4 yd
A:
Q: What is the rate of tariffs for a firetruck imported from the following countries, and what is the…
A: Tarrif that China imposed for the beaf imported increased from 4.8 % to 12% the rate of tariff…
Q: City Index City Index Atlanta 100 | San Francisco 172 Boston | 146 Phoenix 122 Chicago 105 Miami 161…
A:
Q: From the following details, calculate net profit ratio: Particulars 1,00,000 6,000 70,000 10,000…
A:
Q: Example 8: Calculate the following ratios: 1) Gross profit ratio 3) Current ratio 2). Ņet profit…
A:
Q: Consider the monthly earning of a small business. Table 3 1077 1070 1070 100
A: Note: Hi there! Thank you for posting the question. As you have posted multiple questions, as per…
Q: Wilson Steel Company had ending inventory of $254,300 this year, ending inventory of $156,000 last…
A: Given that, The ending inventory of Wilson steel company this year = $ 254,300 The ending…
Q: If the annual earning per share for MRF is $ 1.6, yesterday closing price $ 7.9. Find PE ratio. O…
A:
Q: The gross profit for Exxon Mobil Corporation for various years is given here. Gross Profit Year (in…
A: From the previous part. The model is given by, P=1447t+54
Q: Consider the following model for Malaysia from year 2009 to 2018. Y = 15.2689+0.8546 X, – 0.3259 X;…
A: Let Y: Consumption expenditure(RM) X1: Income(RM) X2: Wealth(RM) n=10 Since R2 value=0.9985 implies…
Q: Table 3.2 Exports, Imports and Balance of Trade of India, 1993-94 to 1999-2000 (Rs '000 crore)…
A:
Q: The gross profit for United Parcel Service, Inc. has been increasing steadily for the past several…
A: Consider 2010 as the base year then, t=0. Then consider the table as, Years Gross Profit Years…
Q: Suppose that a life insurance company insures 4200 40-year-old people in a given year. (Assume a…
A: Given information Company insures 4200 people Cost of premium = $300 Death Benefit = 55,000
Q: From the data given below find the cost of living index number for 1998. Per cent of total Items…
A:
Q: If it cost $9 to fill a gas tank in 1980, how much would it have cost to fill the same tank in 1990?…
A: Find your answer below
Q: 10-9. Calculate the weighted price index from the following data; Unit Quantity required Price (Rs.)…
A:
Q: Prepare index Numbers of price for three years with average price as base from the data given below…
A:
Q: The table below shows monthly data collected on production costs and on the number of units produced…
A: Given information: The data represents the values of the variables Total production costs and level…
Q: Calculate the cost of Living Index Number using both the Aggregate Expenditure Method and Family…
A:
Q: Table 2: Observation of Monocot & Dicot Monocot Dicot Location Serrated Lobed Leaf Smooth Serrated…
A: Percentage = Total/ Average ×100v
Q: Calculate the missing information for the purchase. Selling Sales Sales Excise Excise Total Item…
A:
Q: population census 1991 is 60,840, population census 2001 is 76,886, births are 13,408, deaths are…
A: Given that ; Total population in 1991 = 60840 Total population in 2001 = 76886 Births (B) = 13408…
Q: below. AMOUNT OF COMMISSION TOTAL SALES COMMISSION RATE P40,000 1 1 3% 2. P2,500 5% P150,000 3.…
A: # we are entitled to solve three subparts, please resubmit the other parts if you wish to get them…
Q: suppose that your long-lost Aunt Sara has left you an unexpected inheritance of $22,400. You have…
A: Let x (dollars) be the amount of money to be invested in stocks. Amount to be invested in bonds =…
Q: If the annual earning per share for MRF is $ 3.8 , yesterday closing price $ 8.6. Find PE ratio.…
A: PE Ratio is given as = Closing Price / Earning per share
Q: What is the estimated total cost to attend the FIRST YEAR of this university? $
A:
Q: Calculate the consumers sumplos at the indicated unit price P for the demandh equation
A:
Q: Example 4: Following ständard and actual working hours and rate: Standard Hours Rate per hour Total…
A:
Q: QUESTION: From the given table, compute for the crude birth rate for every 1000 population in…
A: The birth rate explains the number of birth per 1000. The crude birth rate per 1000 is calculated by…
Q: Consider the following quarterly demand level for electricity (in 1000 megawatts) in Mankweng from…
A: Let us consider, Q1 as first quarter, Q2 as second quarter, Q3 as third quarter and Q4 as four…
Q: Table 5.1. Computing a grade point average [R149] Grade Equivalent Quality Grade Point Credits Point…
A: GPA on a 4.0 scale A = 4.0, A- = 3.7, B+ = 3.3, B = 3.0, B- = 2.7, C+ = 2.3, C = 2.0, C- = 1.7, D+ =…

Step by step
Solved in 2 steps with 2 images

- What is the total effect on the economy of a government tax rebate of $500 to each household in order to stimulate the economy if each household will spend of the rebate in goods and services?LOGIC COMPANY Comparative Income Statement For Years Ended December 31, 2017 and 2018 2018 2017 Gross sales $ 20,000 $ 15,750 Sales returns and allowances 800 100 Net sales $ 19,200 $ 15,650 Cost of merchandise (goods) sold 11,750 8,750 Gross profit $ 7,450 $ 6,900 Operating expenses: Depreciation $ 800 $ 650 Selling and administrative 2,950 2,500 Research 650 550 Miscellaneous 460 350 Total operating expenses $ 4,860 $ 4,050 Income before interest and taxes $ 2,590 $ 2,850 Interest expense 660 550 Income before taxes $ 1,930 $ 2,300 Provision for taxes 772 920 Net income $ 1,158 $ 1,380 LOGIC COMPANY Comparative Balance Sheet December 31, 2017 and 2018 2018 2017 Assets Current assets: Cash $ 12,500 $…Assume a sales price per unit of $25, variable cost per unit $15, and total fixed costs of $18000. If no units are sold, how much cost would the company incur?
- c. Consider the following proposed plan: Quarter Demand (hours) Workforce Hires Layoffs Overtime (hours) 1 4,200 9 1 2 6,400 11 2 1,120 3 3,000 9 2 4 4,800 9 480 5 4,400 9 80 6 6,240 11 2 960 7 3,600 9 2 8 4,800 9 480 Total 76 5 4 3,120 Total cost for this plan would be $? (Enter your resThe following data were taken from the annual reports of Big Bang Inc., a manufacturer of fireworks, and Orange Inc., a manufacturer of computers. Big Bang, Inc. Orange, Inc. Cost of goods sold $830,000 $11,540,000 Inventory, end of year 190,000 320,000 Inventory, beginning of year 240,000 290,000 What is the inventory turnover for Big Bang and Orange. a. Big Bang, Inc.: 3.86Orange, Inc.: 37.84 b. Big Bang, Inc.: 3.86Orange, Inc.: 9.65 c. Big Bang, Inc.: 94.55Orange, Inc.: 37.84 d. Big Bang, Inc.: 94.55Orange, Inc.: 9.65Table #7.3.8: Economic Dynamism of Middle Income Countries 25.8057 37.4511 51.915 43.6952 47.8506 43.7178 58.0767 41.1648 38.0793 37.7251 39.6553 42.0265 48.6159 43.8555 49.1361 61.9281 41.9543 44.9346 46.0521 48.3652 43.6252 50.9866 59.1724 39.6282 33.6074 21.6643 7.3.8 Maintaining your balance may get harder as you grow older. A study was conducted to see how steady the elderly is on their feet. They had the subjects stand on a force platform and have them react to a noise. The force platform then measured how much they swayed forward and backward, and the data is in table #7.3.10 ("Maintaining balance while," 2013). Do the data show that the elderly sway more than the mean forward sway of younger people, which is 18.125 mm? Test at the 5% level. Table #7.3.10: Forward/backward Sway (in mm) of Elderly Subjects 19 30 20 19 29 25 21 24 50
- Consider the following table containing yields for mutual funds in different asset classes (small, mid, and large cap). Fund Yield by Asset Class Small Cap Mid Cap Large Cap Fund Yield (%) Fund Yield (%) Fund Yield (%) Explorer Value 2.04 Capital Value 0.96 Equity Income 3.24 Small-Cap Value Index Admiral 2.46 Mid-Cap Value Index Admiral 1.57 High Dividend Yield Index 3.50 Small-Cap Index Admiral Shares 1.49 Extended Market Index Admiral Shares 1.22 500 Index Admiral Shares 1.57 Strategic Small-Cap Equity 0.38 Mid-Cap Index Admiral Shares 1.52 Diversified Equity 1.23 Explorer 0.17 Mid-Cap Growth 2.76 FTSE Social Index 1.42 Small-Cap Growth Index Admiral 0.21 Capital Value 0.32 Growth Equity 2.52 Explorer Value 2.55 Strategic Equity 1.54 U.S. Growth 0.37 Small-Cap ETF 1.44 Capital Opportunity Admiral Shares 2.14 Windsor 1.64 sum of squares for treatmentssum of squares for error≈1.5986≈18.4205 Step 2 of 2 : Find the mean square for treatments. Round…Dave Fletcher, the general manager of North Carolina Engineering Corporation (NCEC), thinks that his firm’s engineer-ing services contracted to highway construction firms are directly related to the volume of highway construction business contractedwith companies in his geographic area. He wonders if this is reallyso, and if it is, can this information help him plan his operationsbetter by forecasting the quantity of his engineering servicesrequired by construction firms in each quarter of the year? Thefollowing table presents the sales of his services and total amountsof contracts for highway construction over the past eight quarters: a) Using this data, develop a regression equation for predictingthe level of demand of NCEC’s services. b) Determine the coefficient of correlation and the standard errorof the estimate.The general fund budget (in billions of dollars) for a U.S. state for 1988 (period 1) to 2011 (period 24) follows. Year Period Budget($ billions) 1988 1 3.03 1989 2 3.29 1990 3 3.56 1991 4 4.31 1992 5 4.36 1993 6 4.51 1994 7 4.65 1995 8 5.15 1996 9 5.34 1997 10 5.66 1998 11 6.01 1999 12 6.30 2000 13 6.48 2001 14 6.75 2002 15 6.56 2003 16 6.78 2004 17 7.08 2005 18 7.65 2006 19 8.48 2007 20 8.57 2008 21 8.66 2009 22 8.43 2010 23 8.33 2011 24 8.86 (a) Construct a time series plot. A time series plot contains a series of 24 points connected by line segments. The horizontal axis ranges from 0 to 25 and is labeled: Period. The vertical axis ranges from 0 to 10 and is labeled: Budget ($ billions). The first point is at approximately (1, 3.0). The rest are plotted from left to right at regular increments of 1 period in an upward, diagonal direction. The last point is at approximately (24, 8.9). Consecutive points are close together…
- ] Consider the following table containing yields for mutual funds in different asset classes (small, mid, and large cap). Fund Yield by Asset Class Small Cap Mid Cap Large Cap Fund Yield (%) Fund Yield (%) Fund Yield (%) Explorer Value 1.22 Capital Value 0.96 Equity Income 3.24 Small-Cap Value Index Admiral 2.46 Mid-Cap Value Index Admiral 0.52 High Dividend Yield Index 3.50 Small-Cap Index Admiral Shares 1.49 Extended Market Index Admiral Shares 1.22 500 Index Admiral Shares 0.52 Strategic Small-Cap Equity 2.61 Mid-Cap Index Admiral Shares 1.52 Diversified Equity 1.23 Explorer 0.17 Mid-Cap Growth 0.82 FTSE Social Index 1.42 Small-Cap Growth Index Admiral 0.21 Capital Value 0.32 Growth Equity 1.42 Explorer Value 1.32 Strategic Equity 1.54 U.S. Growth 0.37 Small-Cap ETF 1.44 Capital Opportunity Admiral Shares 1.27 Windsor 1.64 sum of squares for treatmentssum of squares for error≈1.7894≈15.7229 Step 1 of 2 : What are the degrees of freedom…The general fund budget for a state for 1988 (Period 1) to 2011 (Period 24) follows. Year Period Budget($billions) 1988 1 3.09 1989 2 3.29 1990 3 3.57 1991 4 4.32 1992 5 4.36 1993 6 4.54 1994 7 4.69 1995 8 5.15 1996 9 5.34 1997 10 5.67 1998 11 6.01 1999 12 6.2 2000 13 6.48 2001 14 6.65 2002 15 6.56 2003 16 6.78 2004 17 6.98 2005 18 7.65 2006 19 8.38 2007 20 8.57 2008 21 8.66 2009 22 8.43 2010 23 8.23 2011 24 8.76 Develop a linear trend equation for this time series. Round your answers to 4 decimals. T t = + t What is the forecast for 2012? Round your answer to two decimal places.$ billionSuppose you are the purchasing manager for a company that manufactures scanners and other computer peripherals. Your vendor for scanner motors is now offering "quantity discounts" in the form of instant rebates and lower shipping charges as follows. Quantity Net Price Rebate Shipping 1–500 motors $16 none $1.40 501–1,000 motors 16 $1.40 1.00 1,001–2,000 motors 16 2.00 0.70 (a) Calculate the cost of the motors, including shipping charges, for each category (in $). 1–500 motors$ 501–1,000 motors$ 1,001–2,000 motors$ (b) If you usually purchase 400 motors per month, what percent would be saved per motor by ordering 800 every two months? Round to the nearest tenth of a percent. % (c) What percent would be saved per motor by ordering 1,200 every three months? Round to the nearest tenth of a percent. % (d) How much money (in $) can be saved in a year by purchasing the motors every three months instead of every month? $ (e) What other factors besides price…