Weight Away, a company that sells weight-loss plans, often advertises the effectiveness of its plans by highlighting the stories of a few clients who have lost extraordinary amounts of weight. To get a better indication of the general effectiveness of the plans, we asked Weight Away to send us information about "typical" clients. Weight Away mailed us a brochure with the following histogram, which displays the weight loss (in pounds) over the past month for 50 weight Away clients. (Note that a negative value for weight loss represents a weight gain.) Frequency 15- 13 10 10- 5 5- -10 10 20 30 40 50 Weight loss (in pounds) Based on the histogram, draw the ogive (the cumulative relative frequency polygon) for the Weight Away data. Cumulative relative frequency 1 0.8 0.6 0.4 0.2 [0.00 0.00 0.00 [0.00 [0.00 0.00 0.00
Weight Away, a company that sells weight-loss plans, often advertises the effectiveness of its plans by highlighting the stories of a few clients who have lost extraordinary amounts of weight. To get a better indication of the general effectiveness of the plans, we asked Weight Away to send us information about "typical" clients. Weight Away mailed us a brochure with the following histogram, which displays the weight loss (in pounds) over the past month for 50 weight Away clients. (Note that a negative value for weight loss represents a weight gain.) Frequency 15- 13 10 10- 5 5- -10 10 20 30 40 50 Weight loss (in pounds) Based on the histogram, draw the ogive (the cumulative relative frequency polygon) for the Weight Away data. Cumulative relative frequency 1 0.8 0.6 0.4 0.2 [0.00 0.00 0.00 [0.00 [0.00 0.00 0.00

Glencoe Algebra 1, Student Edition, 9780079039897, 0079039898, 2018
18th Edition
ISBN:9780079039897
Author:Carter
Publisher:Carter
Chapter10: Statistics
Section10.6: Summarizing Categorical Data
Problem 42PFA

Related questions
Question
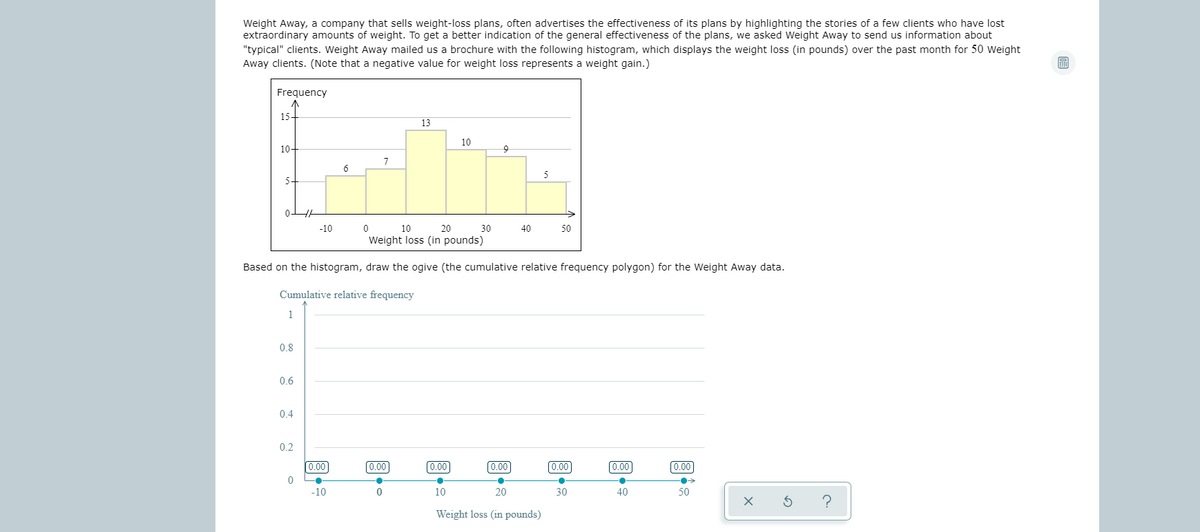
Transcribed Image Text:Weight Away, a company that sells weight-loss plans, often advertises the effectiveness of its plans by highlighting the stories of a few clients who have lost
extraordinary amounts of weight. To get a better indication of the general effectiveness of the plans, we asked Weight Away to send us information about
"typical" clients. Weight Away mailed us a brochure with the following histogram, which displays the weight loss (in pounds) over the past month for 50 weight
Away clients. (Note that a negative value for weight loss represents a weight gain.)
Frequency
15-
13
10
10-
6
5
5-
-10
10
20
30
40
50
Weight loss (in pounds)
Based on the histogram, draw the ogive (the cumulative relative frequency polygon) for the Weight Away data.
Cumulative relative frequency
1
0.8
0.6
0.4
0.2
0.00
0.00
0.00
(0.00
0.00
0.00
0.00
-10
10
20
30
40
50
Weight loss (in pounds)
Expert Solution
This question has been solved!
Explore an expertly crafted, step-by-step solution for a thorough understanding of key concepts.

This is a popular solution!

Trending now
This is a popular solution!

Step by step
Solved in 2 steps with 3 images

Recommended textbooks for you
Glencoe Algebra 1, Student Edition, 9780079039897…
Algebra
ISBN:
9780079039897
Author:
Carter
Publisher:
McGraw Hill

Holt Mcdougal Larson Pre-algebra: Student Edition…
Algebra
ISBN:
9780547587776
Author:
HOLT MCDOUGAL
Publisher:
HOLT MCDOUGAL

Big Ideas Math A Bridge To Success Algebra 1: Stu…
Algebra
ISBN:
9781680331141
Author:
HOUGHTON MIFFLIN HARCOURT
Publisher:
Houghton Mifflin Harcourt
Glencoe Algebra 1, Student Edition, 9780079039897…
Algebra
ISBN:
9780079039897
Author:
Carter
Publisher:
McGraw Hill
Holt Mcdougal Larson Pre-algebra: Student Edition…
Algebra
ISBN:
9780547587776
Author:
HOLT MCDOUGAL
Publisher:
HOLT MCDOUGAL
Big Ideas Math A Bridge To Success Algebra 1: Stu…
Algebra
ISBN:
9781680331141
Author:
HOUGHTON MIFFLIN HARCOURT
Publisher:
Houghton Mifflin Harcourt