
Chapter12: Ratio And Proportion
Section: Chapter Questions
Problem 5.3P

Related questions

Question
.
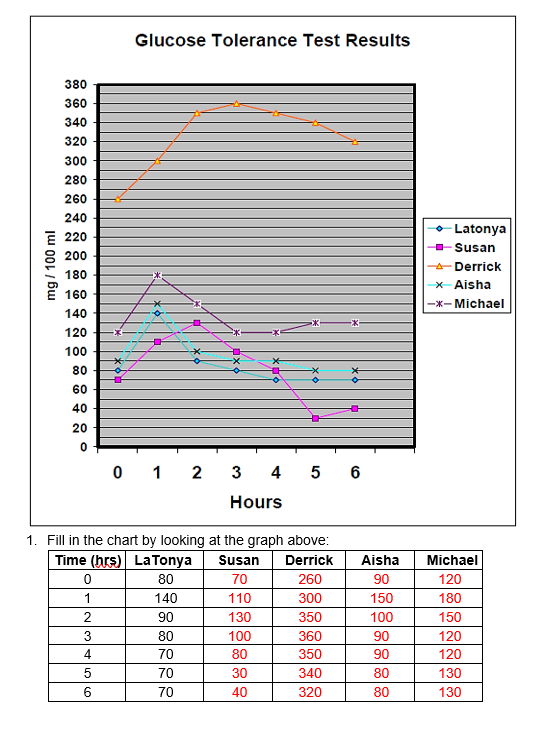
Transcribed Image Text:Glucose Tolerance Test Results
380
360
340
320
300
280
260
240
Latonya
E 220
Susan
200
A Derrick
180
X-Aisha
160
|-x- Michael
140
120
100
80
60
40
20
0 1 2
3 4
5 6
Hours
1. Fill in the chart by looking at the graph above:
Time (hrs) La Tonya
Susan
Derrick
Aisha
Michael
80
70
260
90
120
1
140
110
300
150
180
90
130
350
100
150
3
80
100
360
90
120
4
70
80
350
90
120
70
30
340
80
130
6.
70
40
320
80
130
mg / 100 ml
Transcribed Image Text:Were all the student subject responses within normal parameters? Why or why not?
Expert Solution
This question has been solved!
Explore an expertly crafted, step-by-step solution for a thorough understanding of key concepts.

Step by step
Solved in 2 steps

Knowledge Booster


Learn more about
Need a deep-dive on the concept behind this application? Look no further. Learn more about this topic, biology and related others by exploring similar questions and additional content below.Recommended textbooks for you