What are the formulas used to get the answer in dividens, addition to retained earnings, short-term debt, and long-term debt.
What are the formulas used to get the answer in dividens, addition to retained earnings, short-term debt, and long-term debt.
Corporate Financial Accounting
14th Edition
ISBN:9781305653535
Author:Carl Warren, James M. Reeve, Jonathan Duchac
Publisher:Carl Warren, James M. Reeve, Jonathan Duchac
Chapter14: Financial Statement Analysis
Section: Chapter Questions
Problem 14.6EX: Current position analysis The following data were taken from the balance sheet of Nilo Company at...
Related questions
Question
100%
What are the formulas used to get the answer in dividens, addition to
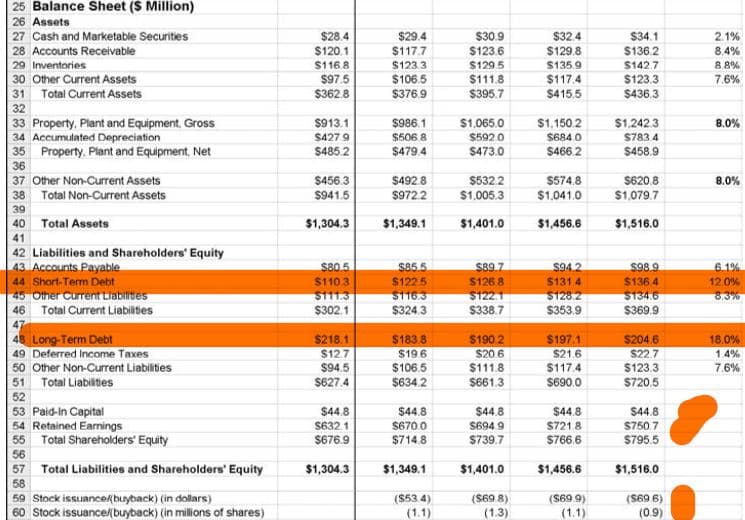
Transcribed Image Text:25 Balance Sheet ($ Million)
26 Assets
27 Cash and Marketable Securities
28 Accounts Receivable
29 Inventories
30 Other Current Assets
$28.4
$29.4
$30.9
$32.4
$34.1
2.1%
$120.1
$117.7
$123.6
$129.8
$136.2
8.4%
$116 8
$123.3
$129.5
$135.9
$142.7
8.8%
$97.5
$362.8
$106.5
$376.9
$111.8
$395.7
$123.3
$436.3
$117.4
7.6%
31 Total Current Assets
$415.5
32
33 Property, Plant and Equipment, Gross
34 Accumulated Depreciation
35 Property. Plant and Equipment, Net
36
37 Other Non-Current Assets
38 Total Non-Current Assets
$913.1
$986.1
$1,065.0
$1,150.2
$1,242.3
8.0%
$427 9
$506.8
$5920
S684.0
S783.4
$4852
$479.4
$473.0
$466.2
$458.9
$456.3
$492.8
$532.2
$574.8
$620.8
8.0%
$941.5
$972.2
$1,005.3
$1.041.0
$1,079.7
39
40 Total Assets
$1,304.3
$1,349.1
$1,401.0
$1,456.6
$1,516.0
41
42 Liabilities and Shareholders' Equity
43 Accounts Payable
44 Short-Term Debt
45 Other Current tiabilites
46 Total Current Liabilities
S98.9
S897
$126 8
s80.5
S1103
$111.3
$302.1
$85.5
$1225
S94.2
$131 4
6.1%
$136 4
12.0%
$1163
$324.3
$1221
$338.7
$128.2
$353.9
$134.6
$369.9
8.3%
48 Long-Term Debt
49 Deferred Income Taxes
50 Other Non-Current Liabilities
51 Total Liabilities
$197.1
$216
$218.1
$183.8
$190.2
$204.6
18.0%
$19.6
$106.5
S20 6
$111.8
$12.7
$22.7
$123.3
1.4%
$94.5
$117.4
7.6%
$627.4
$634.2
S661.3
S690.0
$720.5
52
53 Paid-in Capital
54 Retained Earnings
55 Total Shareholders' Equity
$44.8
$44.8
$44.8
$44.8
$44.8
S694. 9
$739.7
S632.1
$670.0
S721.8
S750 7
$676.9
$714.8
$766.6
S795.5
56
57
Total Liabilitios and Shareholders' Equity
$1,304.3
$1,349.1
$1,401.0
$1,456.6
$1,516.0
58
59 Stock issuancekbuyback) (in dollars)
60 Stock issuance(buyback) (in millions of shares)
(S53.4)
(1.1)
($69 8)
(1.3)
($69 9)
(1.1)
(S69 6)
(0.9)
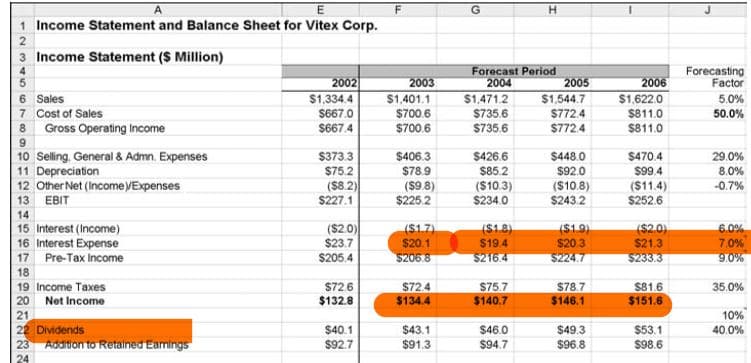
Transcribed Image Text:A
H.
1 Income Statement and Balance Sheet for Vitex Corp.
3 Income Statement ($ Million)
Forecast Period
2004
$1,471.2
Forecasting
Factor
2002
$1,334.4
$667.0
$667.4
2006
$1,622.0
$811.0
$811.0
2005
$1,544.7
6 Sales
7 Cost of Sales
8 Gross Operating Income
2003
$1,401.1
$700.6
$700.6
5.0%
S735.6
$772.4
50.0%
$735.6
$772.4
9.
10 Selling, General & Admn. Expenses
11 Depreciation
12 Other Net (IncomeVExpenses
$373.3
$406.3
$426.6
$448.0
$470.4
29.0%
$92.0
$75.2
($8.2)
$227.1
$789
(S9.8)
$225.2
$85.2
$99.4
8.0%
($10.3)
($10.8)
$243.2
($11.4)
-0.7%
13 EBIT
$234.0
$252.6
14
($2.0)
$23.7
$205.4
(S1.7)
($1.8)
($1.9)
($2.0)
6.0%
15 Interest (Income)
16 Interest Expense
17 Pre-Tax Income
$20.1
$206.8
7.0%
$20.3
$224.7
$19.4
$21,3
$216.4
$233.3
9.0%
18
$78.7
$146.1
S81.6
$151.6
19 Income Taxes
S72.6
$72.4
S75.7
35.0%
20 Net Income
21
22 Dividends
23 Adaton to Retained Eamings
$132.8
$134.4
$140.7
10%
$40.1
$43.1
$46.0
$49.3
$53.1
40.0%
$92.7
$91.3
$94.7
$96.8
$98.6
24
Expert Solution
This question has been solved!
Explore an expertly crafted, step-by-step solution for a thorough understanding of key concepts.
Step by step
Solved in 2 steps with 2 images

Knowledge Booster
Learn more about
Need a deep-dive on the concept behind this application? Look no further. Learn more about this topic, accounting and related others by exploring similar questions and additional content below.Recommended textbooks for you
Corporate Financial Accounting
Accounting
ISBN:
9781305653535
Author:
Carl Warren, James M. Reeve, Jonathan Duchac
Publisher:
Cengage Learning

Survey of Accounting (Accounting I)
Accounting
ISBN:
9781305961883
Author:
Carl Warren
Publisher:
Cengage Learning
Financial & Managerial Accounting
Accounting
ISBN:
9781337119207
Author:
Carl Warren, James M. Reeve, Jonathan Duchac
Publisher:
Cengage Learning

Corporate Financial Accounting
Accounting
ISBN:
9781305653535
Author:
Carl Warren, James M. Reeve, Jonathan Duchac
Publisher:
Cengage Learning

Survey of Accounting (Accounting I)
Accounting
ISBN:
9781305961883
Author:
Carl Warren
Publisher:
Cengage Learning

Financial & Managerial Accounting
Accounting
ISBN:
9781337119207
Author:
Carl Warren, James M. Reeve, Jonathan Duchac
Publisher:
Cengage Learning
Corporate Financial Accounting
Accounting
ISBN:
9781337398169
Author:
Carl Warren, Jeff Jones
Publisher:
Cengage Learning