What CORRECT conclusion can we draw about the Standard Error of the Means considering the data presented in the table? Population A with N = 5,000 3 samples were drawn from each population, carefully following the rules for sample representativeness. Below are the computed means Population B with N = 5,000 from each sample drawn from the population. Sample Mean 1A = 50; n=100 Sample Mean 2A = 100; n=1,150 Sample Mean 2B 112; n-1,500 Sample Mean 3A = 25; n=1,120 Sample Mean 1B = 100; n=1,250 Sample Mean 3B = 120; n= 500 Both Standard Error of the Means of Population A and Population B represent systematic error. Standard Error of the Mean of Population A will be lower compared to the Standard Error of the Mean of Population B. Standard Error of the Mean of Population A will be higher compared to the Standard Error of the Mean of Population B. Standard Error of the Mean of both Population A and Population B will not be significantly different from each other. No conclusion can be made based on the data.
What CORRECT conclusion can we draw about the Standard Error of the Means considering the data presented in the table? Population A with N = 5,000 3 samples were drawn from each population, carefully following the rules for sample representativeness. Below are the computed means Population B with N = 5,000 from each sample drawn from the population. Sample Mean 1A = 50; n=100 Sample Mean 2A = 100; n=1,150 Sample Mean 2B 112; n-1,500 Sample Mean 3A = 25; n=1,120 Sample Mean 1B = 100; n=1,250 Sample Mean 3B = 120; n= 500 Both Standard Error of the Means of Population A and Population B represent systematic error. Standard Error of the Mean of Population A will be lower compared to the Standard Error of the Mean of Population B. Standard Error of the Mean of Population A will be higher compared to the Standard Error of the Mean of Population B. Standard Error of the Mean of both Population A and Population B will not be significantly different from each other. No conclusion can be made based on the data.

Glencoe Algebra 1, Student Edition, 9780079039897, 0079039898, 2018
18th Edition
ISBN:9780079039897
Author:Carter
Publisher:Carter
Chapter10: Statistics
Section: Chapter Questions
Problem 13PT

Related questions
Question
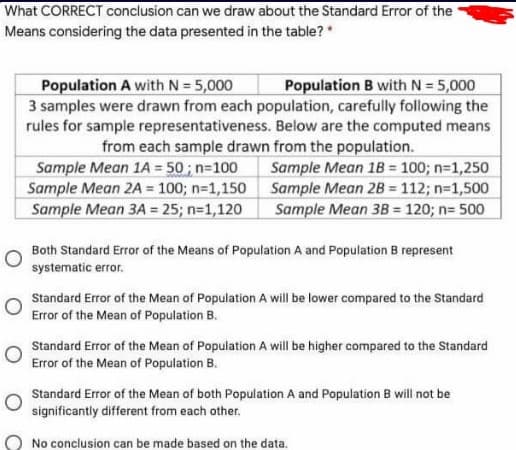
Transcribed Image Text:What CORRECT conclusion can we draw about the Standard Error of the
Means considering the data presented in the table?
Population A with N = 5,000
3 samples were drawn from each population, carefully following the
rules for sample representativeness. Below are the computed means
Population B with N = 5,000
from each sample drawn from the population.
Sample Mean 1A = 50; n=100
Sample Mean 2A = 100; n=1,150
Sample Mean 1B = 100; n=1,250
Sample Mean 2B = 112; n=1,500
Sample Mean 3B = 120; n= 500
Sample Mean 3A = 25; n=1,120
Both Standard Error of the Means of Population A and Population B represent
systematic error.
Standard Error of the Mean of Population A will be lower compared to the Standard
Error of the Mean of Population B.
Standard Error of the Mean of Population A will be higher compared to the Standard
Error of the Mean of Population B.
Standard Error of the Mean of both Population A and Population B will not be
significantly different from each other.
No conclusion can be made based on the data.
Expert Solution
This question has been solved!
Explore an expertly crafted, step-by-step solution for a thorough understanding of key concepts.

This is a popular solution!

Trending now
This is a popular solution!

Step by step
Solved in 2 steps

Recommended textbooks for you
Glencoe Algebra 1, Student Edition, 9780079039897…
Algebra
ISBN:
9780079039897
Author:
Carter
Publisher:
McGraw Hill

College Algebra (MindTap Course List)
Algebra
ISBN:
9781305652231
Author:
R. David Gustafson, Jeff Hughes
Publisher:
Cengage Learning

Glencoe Algebra 1, Student Edition, 9780079039897…
Algebra
ISBN:
9780079039897
Author:
Carter
Publisher:
McGraw Hill
College Algebra (MindTap Course List)
Algebra
ISBN:
9781305652231
Author:
R. David Gustafson, Jeff Hughes
Publisher:
Cengage Learning