What have been the possible reasons for the changes in Return of Equity (ROEs )? •Decompose the ROE into the main components: ROA and EM (Equity Multiplier) •Analyse the sources of Return of Asset (ROA) : Asset Utilisation (AU) and Profit Margin ratios.(PM) •Identify the sources of the changes in Asset Utilisation and Profit Margin
What have been the possible reasons for the changes in Return of Equity (ROEs )? •Decompose the ROE into the main components: ROA and EM (Equity Multiplier) •Analyse the sources of Return of Asset (ROA) : Asset Utilisation (AU) and Profit Margin ratios.(PM) •Identify the sources of the changes in Asset Utilisation and Profit Margin

Survey of Accounting (Accounting I)
8th Edition
ISBN:9781305961883
Author:Carl Warren
Publisher:Carl Warren
Chapter9: Metric-analysis Of Financial Statements
Section: Chapter Questions
Problem 9.17E: Profitability metrics The following selected data were taken from the financial statements of The...

Related questions
Question
What have been the possible reasons for the changes in Return of Equity (ROEs )?
•Decompose the
•Analyse the sources of
•Identify the sources of the changes in Asset Utilisation and Profit Margin
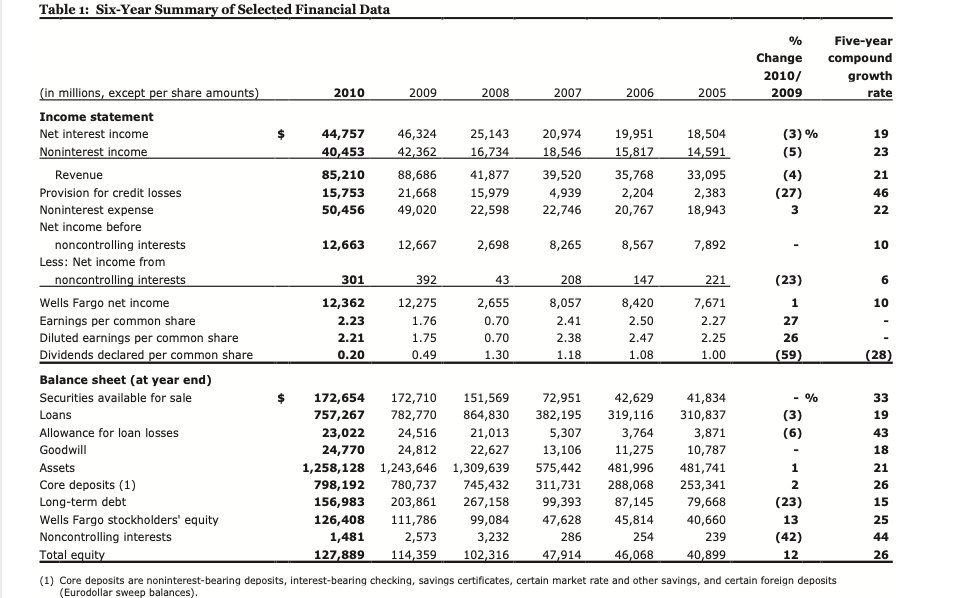
Transcribed Image Text:Table 1: Six-Year Summary of Selected Financial Data
%
Five-year
Change
compound
2010/
growth
(in millions, except per share amounts)
2010
2009
2008
2007
2006
2005
2009
rate
Income statement
44,757
40,453
Net interest income
46,324
25,143
20,974
19,951
18,504
(3) %
19
Noninterest income
42,362
16,734
18,546
15,817
14,591
(5)
23
Revenue
85,210
88,686
41,877
39,520
35,768
33,095
(4)
21
Provision for credit losses
15,753
21,668
15,979
4,939
2,204
2,383
(27)
46
Noninterest expense
Net income before
50,456
49,020
22,598
22,746
20,767
18,943
22
noncontrolling interests
12,663
12,667
2,698
8,265
8,567
7,892
-
10
Less: Net income from
noncontrolling interests
301
392
43
208
147
221
(23)
Wells Fargo net income
12,362
12,275
2,655
8,057
8,420
7,671
1
10
Earnings per common share
2.23
1.76
0.70
2.41
2.50
2.27
27
Diluted earnings per common share
2.21
1.75
0.70
2.38
2.47
2.25
26
Dividends declared per common share
0.20
0.49
1.30
1.18
1.08
1.00
(59)
(28)
Balance sheet (at year end)
172,710
41,834
310,837
Securities available for sale
172,654
151,569
72,951
42,629
- %
33
Loans
757,267
782,770
864,830
382,195
319,116
(3)
19
Allowance for loan losses
23,022
24,516
21,013
5,307
3,764
3,871
(6)
43
Goodwill
24,770
24,812
22,627
13,106
11,275
10,787
18
Assets
1,258,128 1,243,646 1,309,639
798,192
575,442
481,996
481,741
1
21
Core deposits (1)
780,737
745,432
311,731
288,068
253,341
2
26
Long-term debt
156,983
203,861
267,158
99,393
87,145
79,668
(23)
15
Wells Fargo stockholders' equity
126,408
111,786
99,084
47,628
45,814
40,660
13
25
Noncontrolling interests
1,481
2,573
3,232
286
254
239
(42)
44
Total equity
127,889
114,359
102,316
47,914
46,068
40,899
12
26
(1) Core deposits are noninterest-bearing deposits, interest-bearing checking, savings certificates, certain market rate and other savings, and certain foreign deposits
(Eurodollar sweep balances).
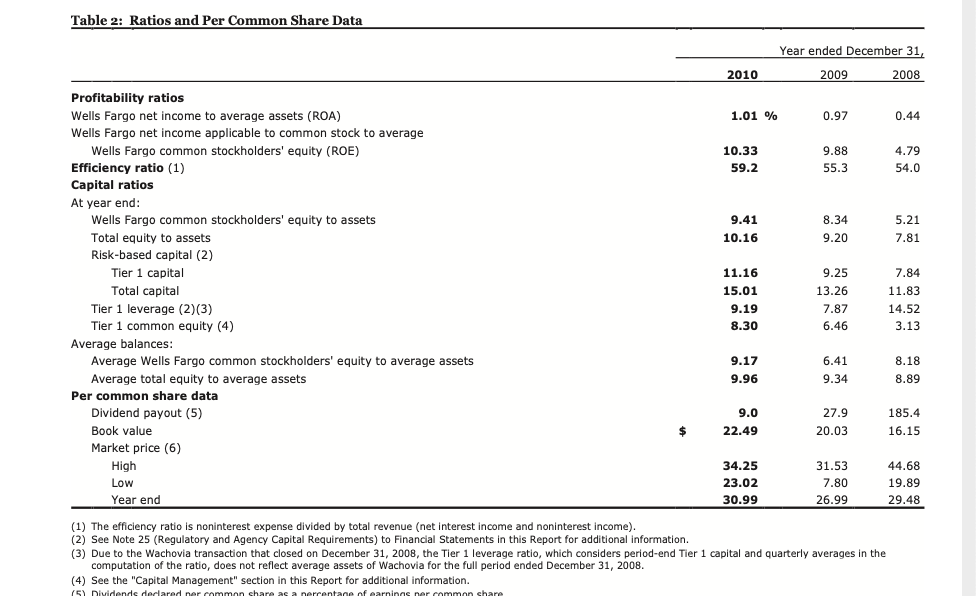
Transcribed Image Text:Table 2: Ratios and Per Common Share Data
Year ended December 31,
2010
2009
2008
Profitability ratios
Wells Fargo net income to average assets (ROA)
1.01 %
0.97
0.44
Wells Fargo net income applicable to common stock to average
Wells Fargo common stockholders' equity (ROE)
10.33
9.88
4.79
Efficiency ratio (1)
59.2
55.3
54.0
Capital ratios
At year end:
Wells Fargo common stockholders' equity to assets
9.41
8.34
5.21
Total equity to assets
10.16
9.20
7.81
Risk-based capital (2)
Tier 1 capital
11.16
9.25
7.84
Total capital
15.01
13.26
11.83
Tier 1 leverage (2)(3)
9.19
7.87
14.52
Tier 1 common equity (4)
8.30
6.46
3.13
Average balances:
Average Wells Fargo common stockholders' equity to average assets
9.17
6.41
8.18
Average total equity to average assets
9.96
9.34
8.89
Per common share data
Dividend payout (5)
9.0
27.9
185.4
Book value
22.49
20.03
16.15
Market price (6)
High
34.25
31.53
44.68
Low
23.02
7.80
19.89
Year end
30.99
26.99
29.48
(1) The efficiency ratio is noninterest expense divided by total revenue (net interest income and noninterest income)
(2) See Note 25 (Regulatory and Agency Capital Requirements) to Financial Statements in this Report for additional information.
(3) Due to the Wachovia transaction that closed on December 31, 2008, the Tier 1 leverage ratio, which considers period-end Tier 1 capital and quarterly averages in the
computation of the ratio, does not reflect average assets of Wachovia for the full period ended December 31, 2008.
(4) See the "Capital Management" section in this Report for additional information.
(5) Dividends dedared per common share as a nercentage of earnings ner common share
Expert Solution
This question has been solved!
Explore an expertly crafted, step-by-step solution for a thorough understanding of key concepts.

Step by step
Solved in 2 steps

Knowledge Booster


Learn more about
Need a deep-dive on the concept behind this application? Look no further. Learn more about this topic, finance and related others by exploring similar questions and additional content below.Recommended textbooks for you
Survey of Accounting (Accounting I)
Accounting
ISBN:
9781305961883
Author:
Carl Warren
Publisher:
Cengage Learning

Managerial Accounting
Accounting
ISBN:
9781337912020
Author:
Carl Warren, Ph.d. Cma William B. Tayler
Publisher:
South-Western College Pub

Financial And Managerial Accounting
Accounting
ISBN:
9781337902663
Author:
WARREN, Carl S.
Publisher:
Cengage Learning,
Survey of Accounting (Accounting I)
Accounting
ISBN:
9781305961883
Author:
Carl Warren
Publisher:
Cengage Learning
Managerial Accounting
Accounting
ISBN:
9781337912020
Author:
Carl Warren, Ph.d. Cma William B. Tayler
Publisher:
South-Western College Pub
Financial And Managerial Accounting
Accounting
ISBN:
9781337902663
Author:
WARREN, Carl S.
Publisher:
Cengage Learning,

Financial Accounting
Accounting
ISBN:
9781337272124
Author:
Carl Warren, James M. Reeve, Jonathan Duchac
Publisher:
Cengage Learning

Intermediate Accounting: Reporting And Analysis
Accounting
ISBN:
9781337788281
Author:
James M. Wahlen, Jefferson P. Jones, Donald Pagach
Publisher:
Cengage Learning

Financial Reporting, Financial Statement Analysis…
Finance
ISBN:
9781285190907
Author:
James M. Wahlen, Stephen P. Baginski, Mark Bradshaw
Publisher:
Cengage Learning