NIKE,INC Financial Statement Analysis The financial statements for Nike, Inc., are presented in photos in the photos provided below. Use the following additional information (in millions): Accounts receivable at May 31, 2016 $3,241 Inventories at May 31, 2016 $4,838 Total assets at May 31, 2016 $21,379 Stockholders' equity at May 31, 2016 $12,258 1. Determine the following measures for the fiscal years ended May 31, 2018, and May 31, 2017. Assume 365 days a year. Do not round interim calculations. Round the working capital amount in part (a) to the nearest dollar. Round all other final answers to one decimal place. When required, use the rounded final answers in subsequent computations. May 31, 2018 May 31, 2017 QUESTION BELOW A-L With work shown for each letter PLEASE: As an explanation is needed. a. Working capital (in millions) $ $ b. Current ratio c. Quick ratio d. Accounts receivable turnover e. Number of days' sales in receivables days days f. Inventory turnover g. Number of days' sales in inventory days days h. Ratio of liabilities to stockholders' equity i. Asset turnover j. Return on total assets % % k. Return on common stockholders' equity % % l. Price-earnings ratio, assuming that the market price was $72.12 per share on May 29, 2018, and $53.06 per share on May 30, 2017. 2. The working capital ___________ between 2017 and 2018. The current and quick ratios both__________during 2018. The accounts receivable turnover_____________ and number of days’ sales in receivables _____________ slightly. The margin of protection to creditors ______________ . The return on total assets ______________ during 2018. The return on common stockholders’ equity ______________.
NIKE,INC Financial Statement Analysis The financial statements for Nike, Inc., are presented in photos in the photos provided below. Use the following additional information (in millions): Accounts receivable at May 31, 2016 $3,241 Inventories at May 31, 2016 $4,838 Total assets at May 31, 2016 $21,379 Stockholders' equity at May 31, 2016 $12,258 1. Determine the following measures for the fiscal years ended May 31, 2018, and May 31, 2017. Assume 365 days a year. Do not round interim calculations. Round the working capital amount in part (a) to the nearest dollar. Round all other final answers to one decimal place. When required, use the rounded final answers in subsequent computations. May 31, 2018 May 31, 2017 QUESTION BELOW A-L With work shown for each letter PLEASE: As an explanation is needed. a. Working capital (in millions) $ $ b. Current ratio c. Quick ratio d. Accounts receivable turnover e. Number of days' sales in receivables days days f. Inventory turnover g. Number of days' sales in inventory days days h. Ratio of liabilities to stockholders' equity i. Asset turnover j. Return on total assets % % k. Return on common stockholders' equity % % l. Price-earnings ratio, assuming that the market price was $72.12 per share on May 29, 2018, and $53.06 per share on May 30, 2017. 2. The working capital ___________ between 2017 and 2018. The current and quick ratios both__________during 2018. The accounts receivable turnover_____________ and number of days’ sales in receivables _____________ slightly. The margin of protection to creditors ______________ . The return on total assets ______________ during 2018. The return on common stockholders’ equity ______________.
NIKE,INC Financial Statement Analysis The financial statements for Nike, Inc., are presented in photos in the photos provided below. Use the following additional information (in millions): Accounts receivable at May 31, 2016 $3,241 Inventories at May 31, 2016 $4,838 Total assets at May 31, 2016 $21,379 Stockholders' equity at May 31, 2016 $12,258 1. Determine the following measures for the fiscal years ended May 31, 2018, and May 31, 2017. Assume 365 days a year. Do not round interim calculations. Round the working capital amount in part (a) to the nearest dollar. Round all other final answers to one decimal place. When required, use the rounded final answers in subsequent computations. May 31, 2018 May 31, 2017 QUESTION BELOW A-L With work shown for each letter PLEASE: As an explanation is needed. a. Working capital (in millions) $ $ b. Current ratio c. Quick ratio d. Accounts receivable turnover e. Number of days' sales in receivables days days f. Inventory turnover g. Number of days' sales in inventory days days h. Ratio of liabilities to stockholders' equity i. Asset turnover j. Return on total assets % % k. Return on common stockholders' equity % % l. Price-earnings ratio, assuming that the market price was $72.12 per share on May 29, 2018, and $53.06 per share on May 30, 2017. 2. The working capital ___________ between 2017 and 2018. The current and quick ratios both__________during 2018. The accounts receivable turnover_____________ and number of days’ sales in receivables _____________ slightly. The margin of protection to creditors ______________ . The return on total assets ______________ during 2018. The return on common stockholders’ equity ______________.
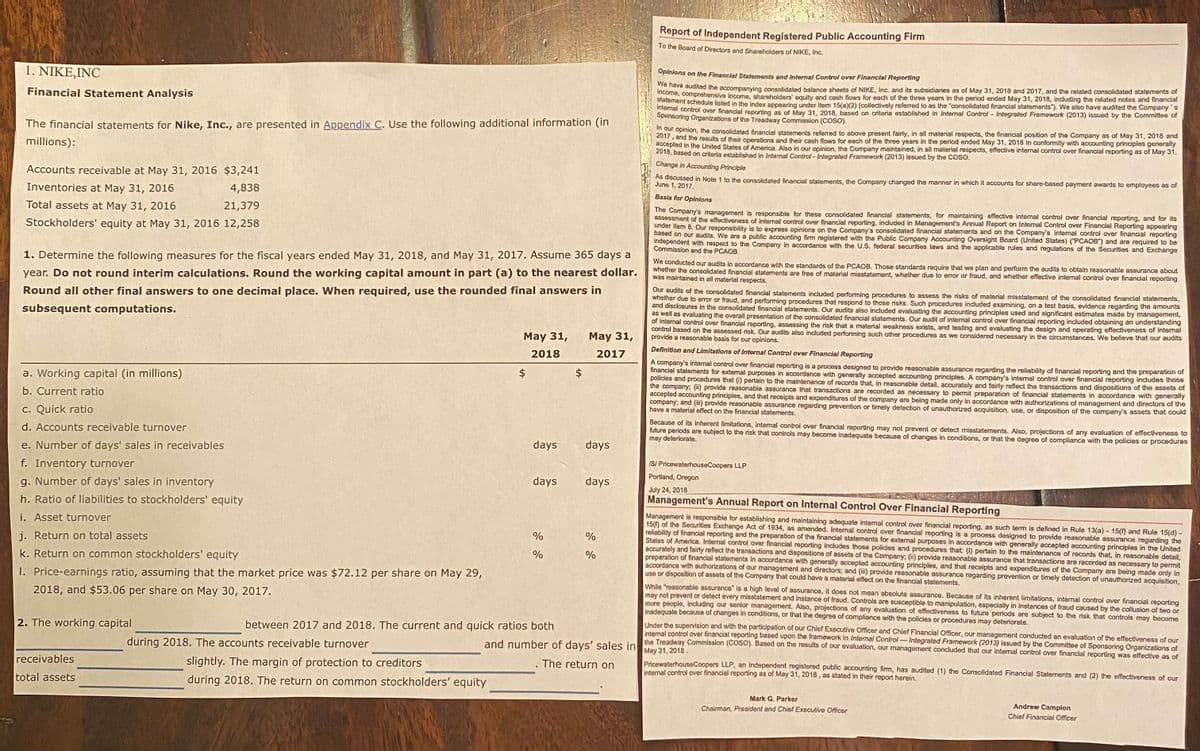
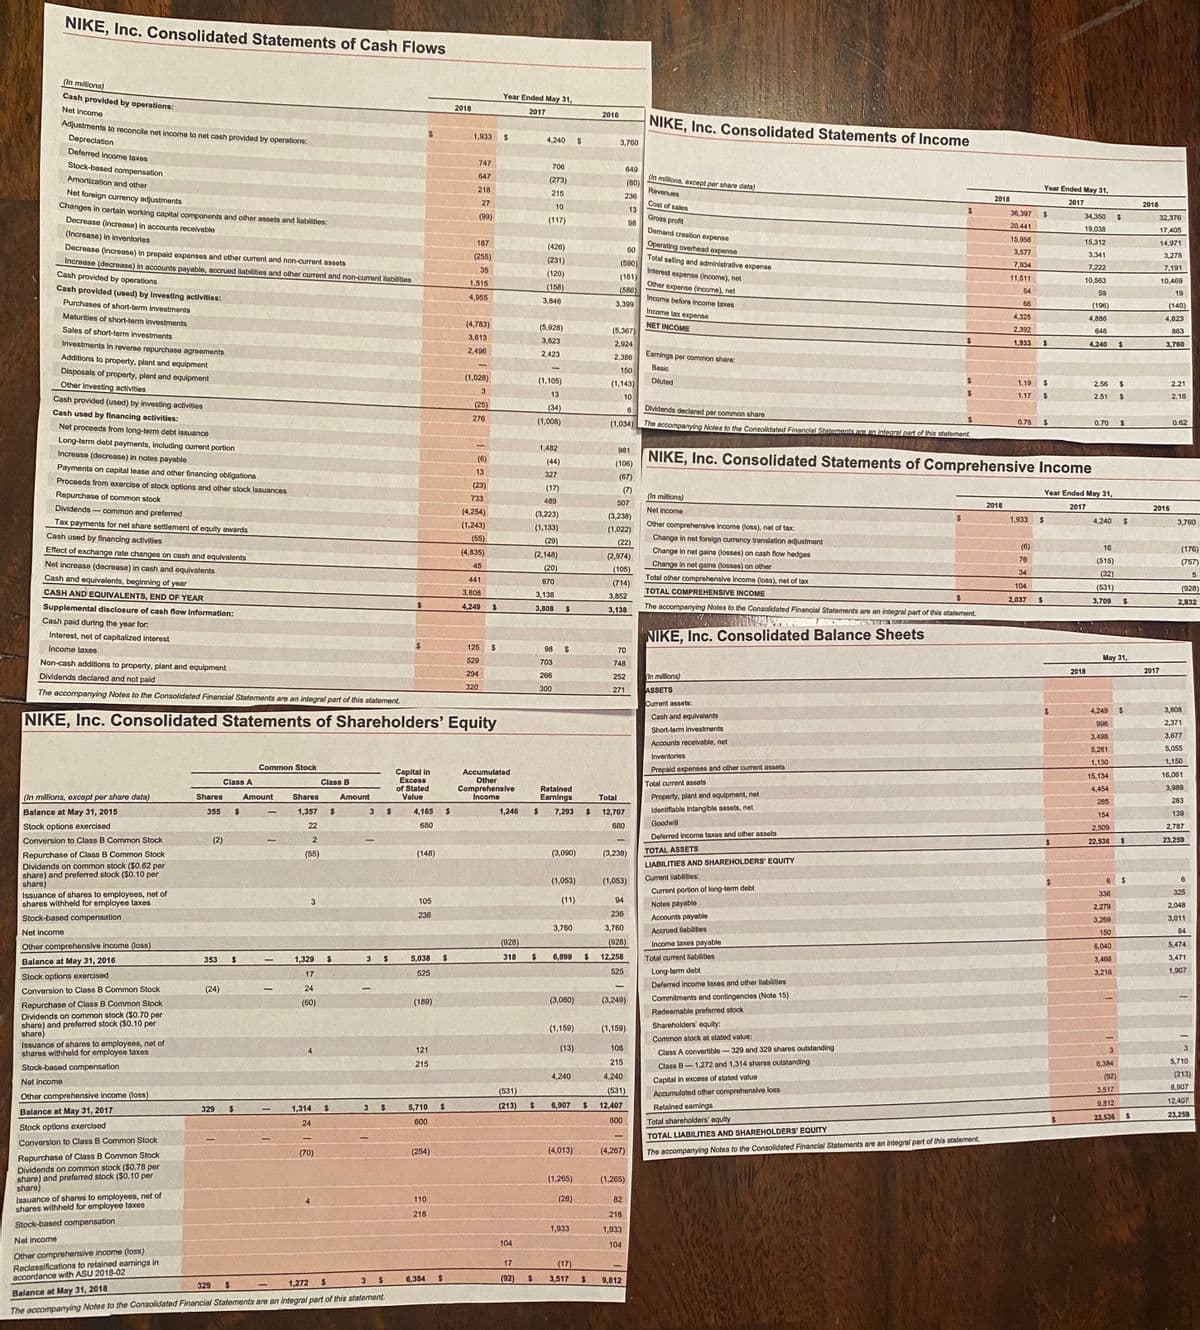
The financial statements for Nike, Inc., are presented in photos in the photos provided below.
Use the following additional information (in millions):
Accounts receivable at May 31, 2016 $3,241 Inventories at May 31, 2016 $4,838 Total assets at May 31, 2016 $21,379 Stockholders' equity at May 31, 2016 $12,258
1. Determine the following measures for the fiscal years ended May 31, 2018, and May 31, 2017.
Assume 365 days a year.
Do not round interim calculations.
Round the working capital amount in part (a) to the nearest dollar.
Round all other final answers to one decimal place.
When required, use the rounded final answers in subsequent computations.
May 31, 2018 May 31, 2017
QUESTION BELOW A-L With work shown for each letter PLEASE: As an explanation is needed. a. Working capital (in millions) $ $ b. Current ratio c. Quick ratio d. Accounts receivable turnover e. Number of days' sales in receivables days days f. Inventory turnover g. Number of days' sales in inventory days days h. Ratio of liabilities to stockholders' equity i. Asset turnover j. Return on total assets % % k. Return on common stockholders' equity % % l. Price-earnings ratio, assuming that the market price was $72.12 per share on May 29, 2018, and $53.06 per share on May 30, 2017.
2. The working capital ___________ between 2017 and 2018. The current and quick ratios both__________during 2018. The accounts receivable turnover_____________ and number of days’ sales in receivables _____________ slightly. The margin of protection to creditors ______________ . The return on total assets ______________ during 2018. The return on common stockholders’ equity ______________.
Transcribed Image Text:and number of days' sales in he Treadway Commission (COSO). Based on the results of our evaluation, our management concluded that our intemal control over financial reporting was effective as of
Report of Independent Registered Public Accounting Firm
To the Board of Directors and Shareholders of NIKE, Inc.
1. NIKE,INC
Opinions on the Financial Statements and Internal Control over Financlal Reporting
Ne nave audited the accompanying consolidated balance sheets of NIKE, Inc. and its subsidiaries as of May 31, 2018 and 2017, and the related consolidated statements of
come, comprehensive income, shareholders' equity and cash flows for each of the three years in the period ended May 31, 2018, including the related notes and financial
Statement schedule listed in the index appearing under Item 15(a)(2) (collectively referred to as the "consolidated financial statements"). We also have audited the Company 's
Internal control over financial reporting as of May 31, 2018, based on criteria established in Internal Control - Integrated Framework (2013) issued by the Committee of
Sponsoring Organizations of the Treadway Commission (COSO).
Financial Statement Analysis
The financial statements for Nike, Inc., are presented in Appendix C. Use the following additional information (in
In our opinion, the consolidated financial statements referred to above present fairly, in all material respects, the financial posítion of the Company as of May 31, 2018 and
2017, and the results of their operations and their cash flows for each of the three years in the period ended May 31, 2018 in conformity with accounting principles generally
accepted in the United States of America. Also in our opinion, the Company maintained, in all material respects, effective internal control over financial reporting as of May 31,
2018, based on criteria established in Internal Control - Integrated Framework (2013) issued by the COSO.
millions):
Change in Accounting Principle
Accounts receivable at May 31, 2016 $3,241
Inventories at May 31, 2016
4,838
As discussed in Note 1 to the consolidated financial statements, the Company changed the manner in which it accounts for share-based payment awards to employees as of
June 1, 2017.
Basis for Opinions
Total assets at May 31, 2016
21,379
The Company's management is responsible for these consolidated financial statements, for maintaining effective intemal control over financial reporting, and for its
assessment of the effectiveness of internal control over financial reporting, indluded in Management's Annual Report on Internal Control over Financial Reporting appearing
under Item 8. Our responsibility is to express opinions on the Company's consolidated financial statements and on the Company's internal control over financial reporting
based on our audits. We are a public accounting firm registered with the Public Company Accounting Oversight Board (United States) ("PCAOB") and are required to be
Independent with respect to the Company in accordance with the U.S. federal securities laws and the applicable rules and regulations of the Securities and Exchange
Commission and the PCAOB.
Stockholders' equity at May 31, 2016 12,258
1. Determine the following measures for the fiscal years ended May 31, 2018, and May 31, 2017. Assume 365 days a
We conducted our audits in accordance with the standards of the PCAOB. Those standards require that we plan and perform the audits to obtain reasonable assurance about
whether the consolidated financial statements are free of material misstatement, whether due to error or fraud, and whether effective intemal control over financial reporting
was maintained in all material respects.
year. Do not round interim calculations. Round the working capital amount in part (a) to the nearest dollar.
Round all other final answers to one decimal place. When required, use the rounded final answers in
Our audits of the consolidated financial statements included performing procedures to assess the risks of material misstatement of the consolidated financial statements,
whether due to error or fraud, and performing procedures that respond to those risks. Such procedures included examining, on a test basis, evidence regarding the amounts
and disclosures in the consolidated financial statements. Our audits also included evaluating the accounting principles used and significant estimates made by management,
as well as evaluating the overall presentation of the consolidated financial statements. Our audit of intenal control over financial reporting included obtaining an understanding
of internal control over financial reporting, assessing the risk that a material weakness exists, and testing and evaluating the design and operating effectiveness of internal
control based on the assessed risk. Our audits also included performing such other procedures as we considered necessary in the circumstances. We believe that our audits
provide a reasonable basis for our opinions.
subsequent computations.
May 31,
May 31,
Definition and Limitations of Internal Control over Financial Reporting
2018
2017
A company's intemal control over financial reporting is a process designed to provide reasonable assurance regarding the reliability of financial reporting and the preparation of
financial statements for extermal purposes in accordance with generally accepted accounting principles. A company's internal control over financial reporting includes those
policies and procedures that (1) pertain to the maintenance of records that, in reasonable detail, accurately and fairly reflect the transactions and dispositions of the assets of
the company, (i) provide reasonable assurance that transactions are recorded as necessary to permit preparation of financial statements in accordance with generally
accepted accounting principles, and that receipts and expenditures of the company are being made only in accordance with authorizations of management and directors of the
company; and (iii) provide reasonable assurance regarding prevention or timely detection of unauthorized acquisition, use, or disposition of the company's assets that could
have a material effect on the financial statements.
a. Working capital (in millions)
$
b. Current ratio
c. Quick ratio
Because of its inherent limitations, internal control over financial reporting may not prevent or detect misstatements. Also, projections of any evaluation of effectiveness to
future periods are subject to the risk that controls may become inadequate because of changes in conditions, or that the degree of compliance with the policies or procedures
d. Accounts receivable turnover
may deteriorate.
e. Number of days' sales in receivables
days
days
f. Inventory turnover
IS/ PricewaterhouseCoopers LLP
Portland, Oregon
g. Number of days' sales in inventory
days
days
July 24, 2018
Management's Annual Report on Internal Control Over Financial Rep
h. Ratio of liabilities to stockholders' equity
porting
Management is responsible for establishing and maintaining adequate intermal control over financial reporting, as such term is defined in Rule 13(a) - 15(f) and Rule 15(d) -
15() of the Securities Exchange Act of 1934, as amended. Internal control over financial reporting is a process designed to provide reasonable assurance regarding the
reliability of financial reporting and the preparation of the financial statements for external purposes in accordance with generally accepted accounting principles in the United
States of America, Internal control over financial reporting includes those policies and procedures that: (1) pertain to the maintenance of records that, in reasonable detail,
accurately and fairly reflect the transactions and dispositions of assets of the Company; (i) provide reasonable assurance that transactions are recorded as necessary to permit
preparation of financial statements in accordance with generally accepted accounting principles, and that receipts and expenditures of the Company are being made only in
accordance with authorizations of our management and directors; and (i) provide reasonable assurance regarding prevention or timely detection of unauthorized acquisition,
use or disposition of assets of the Company that could have a material effect on the financial statements.
i. Asset turnover
j. Return on total assets
%
k. Return on common stockholders' equity
1. Price-earnings ratio, assuming that the market price was $72.12 per share on May 29,
While "reasonable assurance" is a high level of assurance, it does not mean absolute assurance. Because of its inherent limitations, internal control over financial reporting
may not prevent or detect every misstatement and instance of fraud. Controls are susceptible to manipulation, especially in instances of fraud caused by the collusion of two or
more people, including our senlor management. Also, projections of any evaluation of effectiveness to future periods are subject to the risk that controls may become
Inadequate because of changes in conditions, or that the degree of compliance with the policies or procedures may deteriorate.
2018, and $53.06 per share on May 30, 2017.
2. The working capital
between 2017 and 2018. The current and quick ratios both
Under the supervision and with the participation of our Chief Executive Officer and Chief Financial Officer, our management conducted an evaluation of the effectiveness of our
internal control over financial reporting based upon the framework in Internal Control-Integrated Framework (2013) issued by the Committee of Sponsoring Organizations of
during 2018. The accounts receivable turnover
May 31, 2018.
receivables
slightly. The margin of protection to creditors
The return on
PricewaterhouseCoopers LLP, an independent registered public accounting firm, has audited (1) the Consolidated Financial Statements and (2) the effectiveness of our
internal control over financial reporting as of May 31, 2018 , as stated in their report herein,
total assets
during 2018. The return on common stockholders' equity
Mark G. Parker
Chairman, President and Chief Executive Officer
Andrew Campion
Chief Financial Officer
Transcribed Image Text:NIKE, Inc. Consolidated Statements of Cash Flows
(In millions)
Cash provided by operations:
Year Ended May 31,
Net Income
2018
2017
2016
Adjustments to reconcile net income to net cash provided by operations:
NIKE, Inc. Consolidated Statements of Income
Depreclation
1,933
2$
4,240
2$
3,760
Deferred income taxes
Stock-based compensation
747
706
649
(In millions, except per share data)
(80)
Amortization and other
647
(273)
Net foreign currency adjustments
218
Revenues
Year Ended May 31,
215
236
2018
27
Cost of sales
2017
2016
Changes in certain working capital components and other assets and liabilities:
10
13
(99)
Gross profit
98
36,397
2$
34,350
Decrease (increase) in accounts receivable
32,376
(117)
Demand creation expense
20,441
19,038
17,405
(Increase) in inventories
187
15,956
15,312
Operating overhead expense
60
14,971
Decrease (increase) in prepaid expenses and other current and non-current assets
(426)
(255)
Total selling and administrative expense
3,577
3,341
3,278
Increase (decrease) in accounts payable, accrued liabilities and other current and non-current liabilities
(231)
(590)
Interest expense (income), net
7,934
7,222
7,191
35
Cash provided by operations
(120)
(161)
11,511
10,563
10,469
Cash provided (used) by Investing activities:
1,515
(158)
Other expense (income), net
(586)
54
59
19
4,955
Income before income taxes
Purchases of short-term investments
3,846
3,399
66
(196)
(140)
Income tax expense
Maturities of short-term investments
4,325
4,886
4,623
Sales of short-term investments
(4,783)
(5,928)
NET INCOME
(5,367)
2,392
646
863
3,613
3,623
Investments in reverse repurchase agreements
1,933
2,924
4,240
%24
3,760
Additions to property, plant and equipment
2,496
2,423
Earnings per common share:
2,386
Disposals of property, plant and equipment
150
Basic
(1,028)
(1,105)
(1,143)
Diluted
Other investing activities
1.19
%24
2.56
24
2.21
3.
Cash provided (used) by investing activities
13
10
1.17
2.51
2$
2.16
(25)
(34)
Dividends declared per common share
Cash used by financing activities:
276
%24
The accompanying Notes to the Consolidated Financial Statements are an integral part of this statement.
(1,008)
(1,034)
0,78
%24
0.70
24
0.62
Net proceeds from long-term debt issuance
Long-term debt payments, including current portion
1,482
981
Increase (decrease) in notes payable
NIKE, Inc. Consolidated Statements of Comprehensive Income
(6)
(44)
(106)
Payments on capital lease and other financing obligations
13
327
(67)
Proceeds from exercise of stock options and other stock issuances
(23)
(17)
(7)
(In millions)
Repurchase of common stock
Year Ended May 31,
733
489
507
2018
Dividends- common and preferred
2017
(4,254)
Net income
2016
(3,223)
(3,238)
Tax payments for net share settlement of equity awards
1,933
4,240
24
(1,243)
(1,133)
Other comprehensive income (loss), net of tax:
3,760
(1,022)
Cash used by financing activities
(55)
(29)
Change in net foreign currency translation adjustment
(22)
Effect of exchange rate changes on cash and equivalents
(6)
16
(176)
(4,835)
(2,148)
(2,974)
Change in net gains (losses) on cash flow hedges
Net increase (decrease) in cash and equivalents
Change in net gains (losses) on other
76
(515)
(757)
45
(20)
(105)
34
Cash and equivalents, beginning of year
(32)
441
Total other comprehensive income (loss), net of tax
670
(714)
104
CASH AND EQUIVALENTS, END OF YEAR
TOTAL COMPREHENSIVE INCOME
(531)
(928)
3,808
3,138
3,852
2,037
2$
3,709
24
2,832
Supplemental disclosure of cash flow information:
The accompanying Notes to the Consolidated Financial Statements are an integral part of this statement
4,249
2$
3,808
2$
3,138
Cash paid during the year for:
Interest, net of capitalized interest
NIKE, Inc. Consolidated Balance Sheets
Income taxes
24
125
2$
98
2$
70
Non-cash additions to property, plant and equipment
529
May 31,
703
748
Dividends declared and not paid
294
In millions)
2018
2017
266
252
320
300
271
ASSETS
The accompanying Notes to the Consolidated Financial Statements are an integral part of this statement.
Current assets:
4,249
2$
3,808
NIKE, Inc. Consolidated Statements of Shareholders' Equity
Cash and equivalents
6.
996
2,371
Short-term Investments
3,498
3,677
Accounts receivable, net
5,261
5,055
Inventories
1,130
1,150
Common Stock
Prepaid expenses and other current assets
Capital in
Excess
of Stated
Value
Accumulated
Other
Comprehensive
Income
15,134
16,061
Class A
Class B
Total current assets
Retained
4,454
3,989
(In millions, except per share data)
Shares
Amount
Shares
Amount
Earnings
Total
Property, plant and equipment, net
285
283
Balance at May 31, 2015
355
1,357
2$
2$
4,165
1,246
2$
7,293
24
12,707
Identifiable Intangible assets, net
154
139
Stock options exercised
22
680
680
Goodwill
2,509
2,787
Deferred income taxes and other assets
Conversion to Class B Common Stock
(2)
2.
22,536
2$
23,259
(3,090)
(3,238)
TOTAL ASSETS
Repurchase of Class B Common Stock
Dividends on common stock ($0.62 per
share) and preferred stock ($0.10 per
share)
Issuance of shares to employees, net of
shares withheld for employee taxes
(55)
(148)
LIABILITIES AND SHAREHOLDERS' EQUITY
(1,053)
Current liabilities:
(1,053)
6.
24
Current portion of long-term debt
325
336
3
105
(11)
94
Notes payable
2,279
2,048
Stock-based compensation
236
236
Accounts payable
3,011
3,269
Net income
3,760
3,760
Accrued liabilities
150
84
Other comprehensive income (loss)
(928)
(928)
Income taxes payable
6,040
5,474
353
2$
1,329
24
5,038
24
318
24
6,899
%2$
12,258
Total current llabilities
3,468
3,471
Balance at May 31, 2016
17
525
525
Long-term debt
3,216
1,907
Stock options exercised
Deferred income taxes and other liabilities
24
-
Conversion to Class B Common Stock
(24)
(3,060)
(3,249)
Commitments and contingencies (Note 15)
(189)
Repurchase of Class B Common Stock
Dividends on common stock ($0.70 per
share) and preferred stock ($0.10 per
share)
Issuance of shares to employees, net of
shares withheld for employee taxes
(60)
Redeemable preferred stock
(1,159)
(1,159)
Shareholders' equity:
Common stock at stated value:
4
121
(13)
108
3
Class A convertible-329 and 329 shares outstanding
Stock-based compensation
215
215
Class B-1,272 and 1,314 shares outstanding
6,384
5,710
4,240
4,240
(92)
(213)
Net income
Capital in excess of stated value
(531)
(531)
Accumulated other comprehensive loss
3,517
6,907
Other comprehensive income (loss)
(213)
6,907
9,812
12407
329
24
1,314
%24
24
5,710
%24
12,407
Retained eamings
Balance at May 31, 2017
23,259
600
600
Total shareholders' equity
22,536
24
Stock options exercised
TOTAL LIABILITIES AND SHAREHOLDERS' EQUITY
Conversion to Class B Common Stock
(254)
(4,013)
(4,267)
The accompanying Notes to the Consolidated Financial Statements are an integral part of this statement.
(70)
Repurchase of Class B Common Stock
Dividends on common stock ($0.78 per
share) and preferred stock ($0.10 per
share)
Issuance of shares to employees, net of
shares withheld for employee taxes
(1,265)
(1,265)
4.
110
(28)
82
218
218
Stock-based compensation
1,933
1,933
Net income
104
104
Other comprehensive income (loss)
Reclassifications to retained eamings in
accordance with ASU 2018-02
17
(17)
1,272
2$
3 $
6,384
(92)
%24
3,517
24
9,812
329
Balance at May 31, 2018
The accompanying Notes to the Consolidated Financial Statements are an integral part of this statement.
Definition Definition Money that the business will be receiving from its clients who have utilized the credit provided to buy its goods and services. The credit period typically lasts for a short term, lasting from a few days, a few months, to a year.
Expert Solution
This question has been solved!
Explore an expertly crafted, step-by-step solution for a thorough understanding of key concepts.
Read through expert solutions to related follow-up questions below.
Follow-up Question
What is the answer for these? and how do we find them
k. Return on common stockholders' equity % % l. Price-earnings ratio, assuming that the market price was $72.12 per share on May 29, 2018, and $53.06 per share on May 30, 2017.
Need a deep-dive on the concept behind this application? Look no further. Learn more about this topic, accounting and related others by exploring similar questions and additional content below.