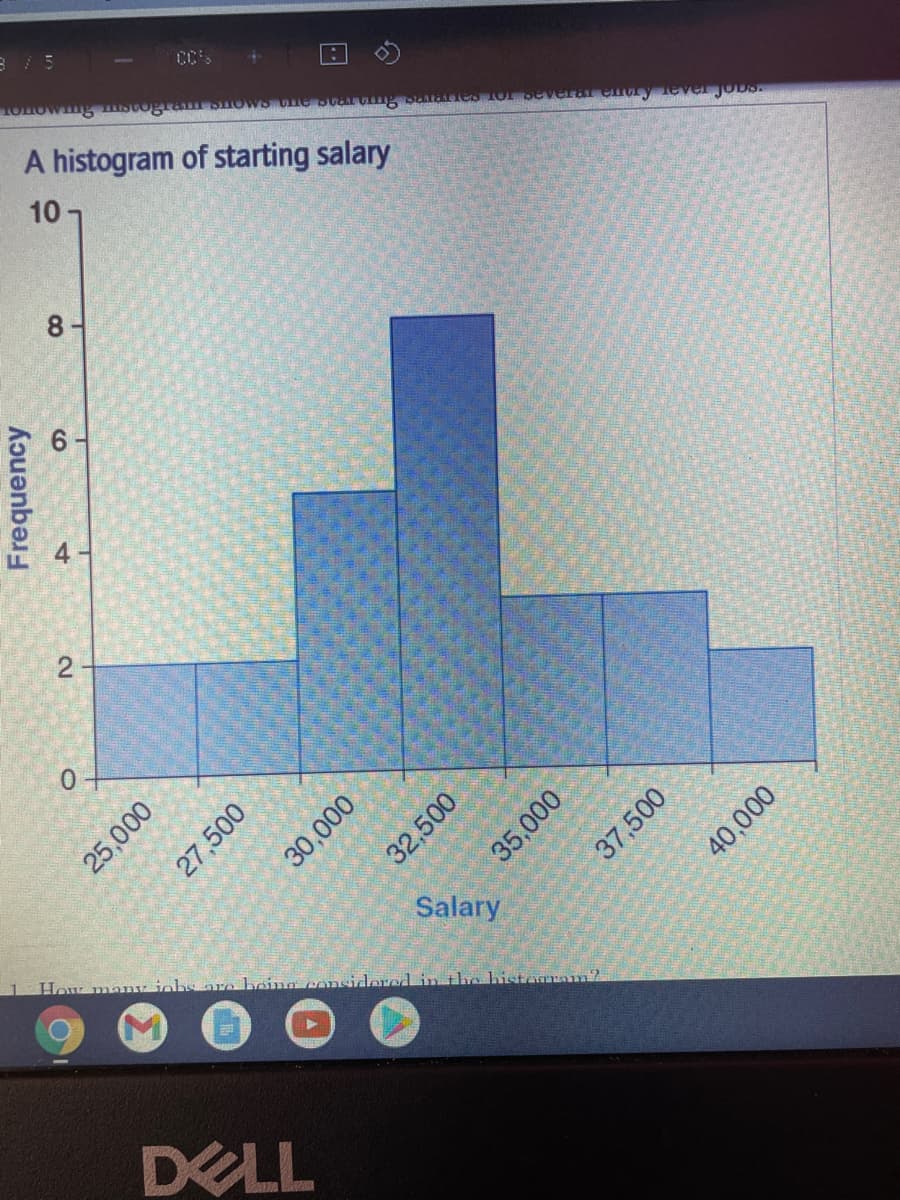
What is the approximate mean of the histogram?(Where does the histogram balance?)
Q: What descriptive statistics would you use for a survey about depression?
A: Descriptive statistics: A descriptive statistic is a summary statistic that quantitatively describes…
Q: What is the difference between prevalence and incidence? Over time, how are the measures of…
A: The Main difference between Prevalence and Incidence is defined as follows Prevalence measures or…
Q: What is the overall mean? What is the mean of Drug 1? What is the mean of Drug 2? What is the mean…
A: Here use sample mean formula
Q: Among the measures of center discussed, which is the only one appropriate for qualitative data?
A: Measures of center: Mean: The arithmetic mean (also called the mean) is the most commonly used…
Q: What are Ohio geological statistics
A: The Geographical data of Ohio State are categorized into the following: Field Trips Mining Minerals…
Q: What does Qualitative data consist of?
A: Qualitative data: Qualitative data is defined as the data that categorize or classify the…
Q: What does a z-score tell you about a data value?
A: Solution: Let X be the random variable. The z-score is the standardized value of the given data.
Q: What is an everyday example of variance within samples?
A: If we need to know the variance within samples, we need to use ANOVA Test.
Q: how would this boxplot look like as an histogram?
A: A box plot and histogram are two graphical ways to describe the data in descriptive statistic. If…
Q: What is the difference between mean, median, and mode? Give examples?
A: Mean:The arithmetic mean (also called the mean) is the most commonly used measure of central…
Q: How to interpret the result according to the above data?
A: Decision Rule: Reject H0 if p value less than or equal to α. Let us consider, α=0.05. From the given…
Q: What is the formula for a deviation score from a population?
A: Formula :
Q: What is the Correlation Coefficient , between ‘case analysis score’ and ‘oral presentation score.’ ?…
A: c) The value of r(correlation) between ‘case analysis score’ and ‘oral presentation score’ is…
Q: What are the features of histogram?
A: Histogram: A histogram is a graphical representation of the numerical data. Histogram is one graph…
Q: What is the significance of the upper and lower line in the nomogram
A: The nomogram is also known as Rumack-Matthew nomogram.
Q: How to build a histogram based on this data
A: Histogram is the graph that helps to visualize the categorical data. It helps to undertsand the…
Q: What is the mean of the current data set? Show your work using the sketchpad below.
A: Measure of central tendency measures the central or average value of a dataset. Measured of…
Q: What kind of test is used to solve the test statistic value for the population proportion?
A: We want to tell you what kind of statistic and test are used for population proportion.
Q: Explain the importance of describing and comparing set of data in analyzing statistical…
A: Importance of comparing and describing a dataset.
Q: 4. What makes a bar chart different from a histogram?
A: The difference between Bar chart and Histogram is given as- Bar Chart Histogram In bar chart,…
Q: What is helpful to interpret bivariate tables~ percentages or frequencies?
A: Given that We have to define What is helpful to interpret bivariate tables percentages or…
Q: What is level of significance?
A: Level of significance: The significance level is a value used as a criterion for deciding how small…
Q: What is Population Mean?
A: The population mean is that one measure of the population which can be used to represent an…
Q: What is the mean, variance and Standard Deviation?
A:
Q: histogram
A: The distribution table given is listed below: Class Frequency 30 - 32 3 33 - 34 6 35 - 36…
Q: Why does the observed mean difference should not be taken seriously?
A: Mean difference(MD): Mean Difference is also known as Difference in means. Mean difference measures…
Q: Deifne different types of Quantitative data ?
A:
Q: 1. How many jobs are being considered in the histogram? 2. How many jobs grant over $35,000? 3. What…
A: 4. Bimodal is the shape of the histogram 5. median is the best measure
Q: I am lookin for the relationship between the sample mean and the population mean and also the…
A: An estimate mus be having few properties in the sense of best estimate.Unbiasdness is one the…
Q: What symbol is used for the arithmetic mean when it is a sample statistic? What symbol is used when…
A: When we calculate the arithmetic mean of a sample or as a sample statistic, it is represented as x¯.…
Q: Use the properties of the mean and median to determine which are the correct mean and median for the…
A: Here we see that from above graph that, distribution is positively skewed. Here mean is lies in…
Q: What are the typical shapes of the histogram?
A: Histogram: A histogram is a graphical representation of the numerical data. Histogram is one graph…
Q: What is the standard error of the mean?
A: Standard error: Standard error is a measure which explains how accurate are the sample means to…
Q: What is difference between mean, median and mode?
A: Mean: The arithmetic mean (also called the mean) is the most commonly used measure of central…
Q: How to determine if a histogram has much variation or little variation?
A: A histogram is a graphical plot of numerical data using bars of different heights. It shows the…
Q: What type of data would you use for collecting data on lap swim time
A: Continuous Data represents measurements and therefore their values can’t be counted but they can be…
Q: What does level of significance indicates?
A:
Q: What is the value of the mean square within?
A: What is the value of the mean square within
Q: What is the level of significance?
A: It is given that the sample size n is 15.
Q: What is an example of a statistical presentation ? What is it telling you ?What areas can the…
A: Statistical presentation is the way of organizing data into tables, graphs or charts.It is useful to…
Q: Does the process of statistical analysis stop at the end of the analysis?
A: Introduction:A statistical data analysis procedure can be performed broadly in the steps-…
Q: What is the formula for the mean absolute deviation formula for paired data sets?
A:
Q: What is histogram?
A: A histogram is a bar graph-like representation of data that buckets a range of outcomes into columns…
Q: Explain the difference between a frequency histogram and a relative-frequency histogram.
A: Frequency distribution: Sometimes an event will be occurred two or more times, the number of…
Q: What is the level of Measurement and type of data?
A: Level of measurement describes the nature of data The four levels of measurement are : nominal,…
Q: What is the Sum of Squares within group? What is the Mean Square between group?
A: Excel Procedure: Enter the data for Autistic, Normal and Mentally in Excel sheet>Go to Data…
Q: What is the mean difference between the samples?
A: Test is that whether the mean number of mass transit trips is equal for both neighborhoods. Note :…
Step by step
Solved in 2 steps with 1 images